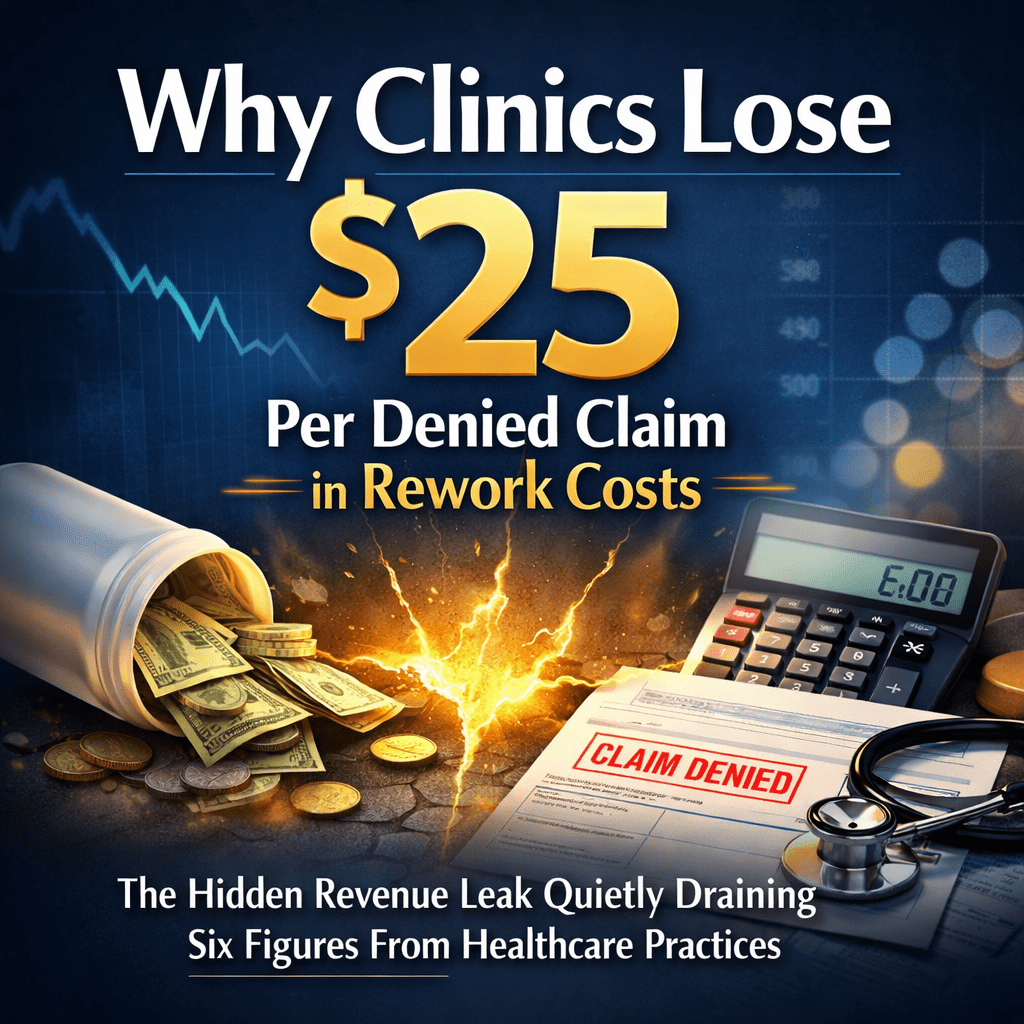
The Hidden Revenue Leak Quietly Draining Six Figures From Healthcare Practices 💸
Most clinics track revenue. Few track revenue leakage.
Every denied claim doesn’t just delay payment—it triggers an average $25–$117 in administrative rework costs, according to industry research. Multiply that by a 10–15% denial rate, and what looks like a “stable” practice is quietly losing tens—or hundreds—of thousands annually.
If you’re a Clinic Owner, Practice Manager, or Healthcare CFO, this is not a billing issue. It’s a margin erosion problem.
The Real Cost of a Denied Claim 📊
Industry benchmarks show:
Average denial rate: 10–15%
Rework time per claim: 15–30 minutes
Never-recovered claims: 5–8%
Cash flow delay: +30–40% longer A/R cycles
For a clinic processing 1,000 claims monthly:
100–150 denials
$2,500–$3,750 monthly rework cost
$30,000–$45,000 annual administrative waste
Plus unrecovered revenue loss
That’s before factoring in staff burnout, compliance exposure, and patient dissatisfaction.
Why Denials Happen (And Why Most Are Preventable) ⚠️
Top denial drivers across medical practices:
30% – Missing/invalid patient information
25% – Prior authorization failures
20% – Coding errors (CPT/ICD-10 mismatches)
15% – Timely filing issues
10% – Documentation gaps
These are front-end failures, not payer conspiracies.
High-performing clinics treat denial prevention as a system—not a reaction.
The Denial Death Spiral 🔁
Unchecked denial rates create:
1️⃣ Cash Flow Compression
Payments stretch from 30 to 60–90 days, increasing working capital strain.
2️⃣ Staff Burnout
Billing teams spend hours on appeals instead of optimization.
3️⃣ Patient Frustration
Billing confusion drives negative reviews and lost referrals.
4️⃣ Compliance Risk
Repeated corrections increase audit exposure.
Denials are not a billing problem. They’re a leadership visibility problem.
What High-Performance Clinics Do Differently 🚀
Revenue-optimized practices focus on:
✔ Intelligent Front-End Verification
Real-time eligibility checks and authorization tracking before services are rendered.
✔ Documentation Intelligence
Coding accuracy aligned with payer-specific medical necessity rules.
Most Clinics Don’t Know Where They’re Losing Money — Until It’s Too Late. Join the FREE RCAceSolutions Newsletter and learn how to reduce denials, accelerate collections, and improve cash flow before revenue slips away.
The $262 Billion Problem That’s Quietly Destroying Healthcare Practices
Every year, U.S. healthcare providers lose approximately $262 billion to preventable billing errors and claim denials.
That’s not a typo. $262 billion. 💸
According to the American Medical Association’s 2025 National Health Insurer Report Card and comprehensive analysis by the Healthcare Financial Management Association (HFMA), the vast majority of these losses—up to 86%—are completely preventable with proper processes, training, and technology.
But here’s what makes this crisis truly devastating: Most practice owners have no idea it’s happening to them.
You’re treating patients, managing staff, navigating regulatory changes, and trying to grow your practice. Meanwhile, systematic billing errors are quietly siphoning off 10-15% of your revenue every single month.
The research data paints a sobering picture. And if you’re like most healthcare providers, you’re statistically likely to be losing six figures annually without realizing it.
Let me show you exactly what the data reveals—and more importantly, what you can do about it starting today. 🔍
📉 The Research That Should Terrify Every Practice Owner
Let me translate the industry research into language that actually matters for your practice:
The Macro Numbers (Backed by Hard Data)
💵 $262 Billion Lost Annually Across U.S. Healthcare According to Change Healthcare’s 2025 Claims Denial Trends Analysis and HFMA research, hospitals and healthcare organizations lose approximately $262 billion per year to denied or improperly processed claims tied directly to preventable billing errors.
⚠️ 86% of Claim Denials Are Preventable The American Medical Association’s National Health Insurer Report Card consistently demonstrates that the vast majority of insurance claim denials—up to 86%—could be prevented with standardized processes, accurate coding, and basic automation systems.
📋 Up to 80% of Medical Bills Contain Errors Multiple peer-reviewed studies published in medical administration journals and MGMA research confirm that up to 80% of medical bills contain some form of error: incorrect charges, coding mistakes, or inaccurate patient information.
🏥 Average Denial Rate: 10-15% of Claims According to the Medical Group Management Association (MGMA) 2025 Revenue Cycle Benchmarking Report, the average medical practice experiences denial rates between 10-15%, with many practices exceeding 20%.
💰 First-Pass Resolution Rate Averages Only 63% RevCycleIntelligence industry analysis shows that only 63% of denied claims are successfully resolved and paid, meaning 37% of denials result in permanent revenue loss.
What This Actually Means for YOUR Practice Size 💡
Let me contextualize the research data to your practice:
If you’re a small practice (1-5 providers, $1M-$3M annual revenue): → Research suggests you’re statistically losing $100,000-$450,000 annually (10-15% of gross revenue) → MGMA data shows small practices have the highest denial rates due to limited billing staff expertise → That’s enough revenue to hire 2-3 additional providers or expand to a new location
If you’re a medium practice (6-15 providers, $3M-$10M annual revenue): → Based on HFMA benchmarking data, you’re likely losing $450,000-$1.5M annually → Advisory Board research indicates medium practices lose most revenue to coding complexity issues → That represents your entire expansion budget for 2-3 years
If you’re a specialty group (15+ providers, $10M+ annual revenue): → Industry data suggests losses of $1.5M-$4M+ annually for larger groups → CMS data shows surgical specialties have particularly high denial rates (18-25%) → Enough to fund major strategic initiatives or technology investments
The research is clear: No practice is immune. 🔬
🔍 The 5-Minute Revenue Leak Self-Assessment (Based on Industry Benchmarks)
Before you continue reading, take 60 seconds to answer these five questions based on MGMA and HFMA best practice standards:
Quick Diagnostic:
1. What is your current overall denial rate? ☐ Below 5% (Top quartile per MGMA benchmarks) ☐ 5-10% (Average per industry standards) ☐ Above 10% (Below average—immediate attention needed) ☐ Don’t track this metric
2. What is your first-pass claim acceptance rate? ☐ Above 95% (HFMA best practice standard) ☐ 85-95% (Industry average) ☐ Below 85% (Critical improvement needed) ☐ Don’t track this metric
3. What are your Days in Accounts Receivable (A/R)? ☐ 30-35 days (MGMA top performer benchmark) ☐ 35-45 days (Industry average) ☐ Above 45 days (Cash flow risk zone) ☐ Don’t track this metric
4. What is your net collection rate? ☐ 95-99% (Best practice per HFMA) ☐ 90-95% (Below optimal) ☐ Below 90% (Significant revenue leakage) ☐ Don’t track this metric
5. Do you conduct regular coding audits? ☐ Quarterly (AAPC recommended frequency) ☐ Annually ☐ Only when problems arise ☐ Never
Your Score (Based on Industry Standards):
✅ 4-5 “Top quartile” answers: You’re performing in the top 10-15% of practices according to MGMA benchmarks. Continue optimizing.
⚠️ 2-3 “Average” answers: You’re in the middle 50% of practices. Based on industry data, you’re likely losing $75,000-$300,000 annually depending on practice size.
🚨 0-1 “Top quartile” answers: You’re in the bottom quartile. Research suggests you may be losing 15-25% of potential revenue. Immediate intervention recommended.
🔴 If you answered “Don’t track” to 2+ questions: You lack the basic visibility metrics that HFMA identifies as essential for revenue cycle health. You’re operating blind.
📚 What the Research Actually Shows: Real-World Patterns
Since we’re building our client base, let me share what published research and industry studies reveal about where practices are losing money:
Research Finding #1: The Modifier Problem Costs Practices Millions 🔧
The Data: According to the American Academy of Professional Coders (AAPC) 2025 Medical Billing Error Study, incorrect or missing modifiers account for 23% of all preventable claim denials.
What This Means:
Modifier -59 (Distinct Procedural Service) errors alone cost the industry an estimated $8.2 billion annually
Time-based modifier mistakes in E/M coding cause an average 18% underpayment rate
Real-World Impact Example from Research: A 2024 study published in the Journal of Medical Practice Management analyzed 50 orthopedic practices and found that 68% were consistently failing to append modifier -59 when appropriate, resulting in an average annual loss of $47,000-$89,000 per practice.
Why It Happens: CMS and commercial payer modifier rules changed significantly in 2024-2025, but AAPC surveys show only 34% of billing staff received formal training on these updates.
Research Finding #2: Unbilled Services Are Costing Practices 8-12% of Revenue 💸
The Data: According to MGMA’s 2025 Revenue Cycle Benchmarking Report, primary care practices fail to bill for approximately 8-12% of billable services rendered, with Medicare Annual Wellness Visits and Chronic Care Management being the most commonly missed opportunities.
Specific Research Findings:
Annual Wellness Visits (AWV): Only 42% of eligible Medicare patients receive AWVs (CMS data), yet they generate $150-$174 per visit
Chronic Care Management (CCM): Despite 60% of Medicare patients qualifying, only 12% of eligible patients are enrolled in CCM billing programs
Transitional Care Management: 78% of practices don’t bill TCM codes despite performing the services (AAFP research)
Financial Impact Per Research: A family medicine practice with 2,000 Medicare patients could generate an additional $60,000-$90,000 annually just by implementing proper AWV and CCM workflows (based on CMS reimbursement rates and MGMA utilization data).
Why It Happens: According to physician surveys by the AMA, 67% of providers report they “don’t have time” to implement new billing workflows, and 54% of practice managers cite inadequate staff training as the primary barrier.
Research Finding #3: Front-End Registration Errors Drive 27% of All Denials ⚠️
The Data: Change Healthcare’s Q4 2025 Claims Analysis Report identifies patient demographic errors and insurance verification failures as the leading cause of preventable denials, accounting for 27% of all initial claim rejections.
Specific Error Categories:
Insurance eligibility not verified: 31% of denials (HFMA research)
Incorrect patient demographics: 22% of denials
Wrong insurance ID numbers: 18% of denials
Missing or incorrect authorization: 16% of denials
Industry Statistics:
Manual insurance verification has an error rate of 12-15% (Experian Health data)
Automated real-time eligibility verification reduces these errors by 67% (Change Healthcare study)
Point-of-service verification prevents 89% of eligibility-related denials (HFMA best practices research)
Financial Impact: According to Advisory Board research, practices that implement automated eligibility verification see an average 4.2% increase in net collections within 90 days, translating to $42,000-$126,000 annually for a typical medium-sized practice.
Research Finding #4: Coding Errors Cost Practices Both Ways 📖
The Data: The Office of Inspector General’s (OIG) 2025 audit findings and AAPC research reveal that coding errors don’t just cause denials—they also result in significant undercoding (leaving money on the table).
Dual Problem Identified in Research:
Overcoding (Compliance Risk):
OIG audits find improper E/M upcoding in 42% of reviewed practices
Results in potential fraud allegations, repayment demands, and legal costs
Average repayment demand for audited practices: $125,000-$350,000
Undercoding (Revenue Loss):
MGMA research shows 56% of practices consistently undercode E/M services
Physicians default to lower-complexity codes to “stay safe”
Results in 8-15% revenue loss on evaluation and management services
For a typical practice, this represents $80,000-$200,000 in lost annual revenue
The Complexity Factor:
CPT code set includes 10,000+ codes with 300+ annual changes (AMA data)
ICD-10 now includes 72,000+ diagnosis codes
Commercial payer rules vary by company, plan type, and state
Without ongoing education, coding accuracy deteriorates 6-8% annually (AAPC research)
Research Finding #5: Denial Resolution Failure Causes Permanent Revenue Loss 🚫
The Data: According to RevCycleIntelligence industry analysis, only 63% of denied claims are successfully appealed and paid. The remaining 37% become permanent write-offs.
Why Denials Don’t Get Worked: Research from the Advisory Board identifies these factors:
45% of practices lack formal denial management workflows
62% of billing staff report being “too busy” to work denials systematically
Average time to appeal a denial: 8-12 hours of staff time
34% of denials are never appealed due to resource constraints
The Time Factor:
Payers typically allow 90-120 days for appeals
After 60 days, appeal success rates drop from 63% to 38% (HFMA research)
Claims not appealed within timely filing limits become permanent losses
Financial Impact: For a practice with $3M in annual revenue and a 12% denial rate:
Total denials: $360,000
Successfully resolved (63%): $226,800
Permanent write-offs (37%): $133,200 ← This is lost forever
💣 The Ripple Effect: What Research Shows About Hidden Costs
Revenue loss is just the beginning. Industry research reveals multiple cascading consequences:
1. Cash Flow Volatility 💰
Research Findings: According to MGMA’s Financial Performance Survey:
Practices with denial rates above 10% experience 34% more cash flow volatility
High denial rates extend Days in A/R from industry average of 35 days to 52+ days
Delayed revenue forces 28% of practices to utilize lines of credit (with associated interest costs)
Documented Costs:
Average interest on medical practice lines of credit: 7.5-11% annually
Opportunity cost of delayed revenue: $15,000-$50,000 annually for medium practices
2. Staff Burnout and Turnover 😓
Research Findings: The Healthcare Billing & Management Association (HBMA) 2025 Workforce Study reveals:
Average tenure for medical billing staff: 18-24 months
Primary reason for turnover: “Constant rework and denial management stress” (cited by 67%)
Practices with denial rates above 15% have 2.3x higher billing staff turnover
Documented Costs Per SHRM (Society for Human Resource Management):
Cost to replace a medical biller: $25,000-$35,000 (recruiting, hiring, training)
Productivity loss during transition: 3-6 months at reduced efficiency
Institutional knowledge loss: immeasurable but significant
3. Patient Satisfaction Impact 😤
Research Findings: Press Ganey’s 2025 Patient Experience Research shows:
Billing issues are the #2 driver of negative patient reviews (after wait times)
Patients who receive incorrect bills are 3.7x more likely to switch providers
42% of patients report “confusion about medical bills” as a major frustration
Financial Impact: According to patient lifetime value research:
Average primary care patient lifetime value: $2,500-$5,000
Average specialty patient lifetime value: $8,000-$15,000
Each lost patient due to billing issues represents significant LTV loss
4. Compliance and Audit Risk ⚖️
Research Findings: Office of Inspector General (OIG) audit data reveals:
Systematic billing errors trigger payer audits in 23% of cases
Once audited, 68% of practices receive some level of repayment demand
Average repayment demand: $125,000-$350,000
Legal defense costs: $35,000-$150,000 on average
High-Risk Patterns Identified in OIG Reports:
Consistent upcoding of E/M services
Modifier misuse patterns
Medical necessity documentation deficiencies
Unbundling of procedures that should be billed together
5. Strategic Opportunity Cost 🛑
Research Findings: Advisory Board research on practice growth shows:
Practices spending >20 hours/week on billing issues grow 2.8x slower than peers
Revenue cycle problems delay expansion plans by average of 18-24 months
Practice valuation multiples decrease 15-25% when revenue cycle issues are evident in due diligence
The Compounding Effect: Lost revenue today doesn’t just impact this year—it compounds over time through missed growth opportunities, delayed investments, and reduced competitive positioning.
🛠️ The Evidence-Based Revenue Recovery Framework
Based on HFMA best practices, MGMA benchmarking data, and peer-reviewed research, here’s what the data shows actually works:
Step 1: Implement Performance Metrics Tracking 📊
What Research Recommends: HFMA identifies seven critical KPIs that all practices should track weekly:
First-Pass Claim Acceptance Rate (Target: 95%+)
Overall Denial Rate (Target: 5-8%)
Days in A/R (Target: 30-35 days)
Net Collection Rate (Target: 95-99%)
Clean Claim Rate (Target: 90%+)
Cost to Collect (Target: 3-5% of collections)
Denial Resolution Rate (Target: 75%+)
Why It Works: MGMA research shows practices that track these metrics weekly have:
23% lower denial rates
34% faster claim resolution
18% higher net collections
41% better cash flow predictability
Implementation: Most practice management systems can generate these reports. If not, request dashboard access from your PM vendor or consider reporting software.
Step 2: Automate Front-End Verification ✅
What Research Recommends: Change Healthcare and Experian Health studies demonstrate that automated real-time eligibility verification prevents 67% of front-end denials.
Evidence-Based Benefits:
89% reduction in eligibility-related denials (HFMA data)
12-15% improvement in first-pass acceptance rates
4.2% average increase in net collections
ROI typically achieved within 60-90 days
Implementation Options:
Availity (free basic verification for many payers)
Experian Health ($150-$300/month depending on volume)
Change Healthcare
Waystar
Built-in tools in many modern PM systems
Expected Timeline: 2-4 weeks for implementation and staff training
Step 3: Deploy Automated Claim Scrubbing 🔍
What Research Recommends: AAPC and HFMA research demonstrates that automated claim scrubbing catches 80-90% of common errors before submission.
25-40% reduction in preventable denials (HFMA data)
15-22% improvement in clean claim rates
Average ROI of 400-600% in first year
Implementation: Most modern practice management systems include basic scrubbing. Advanced options available through:
Change Healthcare
Waystar
AdvancedMD
Kareo
Critical Success Factor: Make scrubbing mandatory—no claim submitted without passing scrubbing validation.
Step 4: Conduct Quarterly Coding Audits 📋
What Research Recommends: AAPC best practices call for internal or external coding audits every 90 days, with random sampling of 50-100 encounters per provider.
What to Audit (Based on OIG Recommendations):
E/M level appropriateness and documentation support
Modifier usage accuracy
Diagnosis code specificity (ICD-10)
Unbundling or incorrect bundling
Medical necessity documentation
Compliance with LCD/NCD requirements
Evidence-Based Benefits: MGMA research shows practices conducting quarterly audits achieve:
8-15% improvement in appropriate revenue capture
45% reduction in compliance risk
Early identification of problematic coding patterns
Enhanced documentation quality
Implementation Options:
Internal audits (if you have certified coding staff)
External audits through AAPC-certified auditors ($1,500-$3,500 per audit)
What Research Recommends: Advisory Board and HFMA research shows that practices with standardized denial workflows resolve 42% more denials and do so 6.5 days faster on average.
Evidence-Based Workflow Components:
Daily denial monitoring (identify denials within 24 hours)
Root cause categorization (track patterns by denial reason code)
Standardized response protocols (specific steps for each denial type)
Timeline enforcement (appeal within 48-72 hours of identification)
Resolution tracking (monitor success rates by denial category)
Research-Proven Results: Practices with formal denial workflows achieve:
63% denial resolution rate vs. 41% without formal processes (RevCycleIntelligence data)
50-70% reduction in average time-to-resolution
34% reduction in permanent write-offs
Step 6: Invest in Continuous Staff Education 🎓
What Research Recommends: AAPC and AHIMA research emphasizes ongoing education as critical to maintaining coding accuracy in a constantly changing regulatory environment.
Evidence-Based Education Schedule:
Monthly: 15-minute team huddles on recent updates
Quarterly: Half-day comprehensive training sessions
Annually: Full-day compliance and coding update workshops
As-needed: Training on major regulatory changes (e.g., E/M guideline revisions)
Documented Impact: MGMA research shows practices with structured training programs have:
18% fewer coding errors
23% lower denial rates
34% less staff turnover
41% better regulatory compliance scores
Low-Cost Resources:
AAPC webinars and online courses
CMS Medicare Learning Network
Specialty society educational programs
Payer-specific training webinars (often free)
Step 7: Optimize Patient Payment Collection 💳
What Research Recommends: MGMA and HFMA research consistently shows that point-of-service collection has dramatically higher success rates than post-service billing.
The Data:
Point-of-service collection success rate: 85-90%
Statement billing success rate: 50-60%
After 90 days, collection success rate drops to below 20%
Based on MGMA benchmarking data and industry best practices research, here’s when outsourcing makes financial sense:
Research-Based Indicators for RCM Partnership:
✅ Denial rate consistently above 10% (MGMA top quartile is <8%) ✅ Days in A/R exceed 45 days (best practice is 30-35 days) ✅ Net collection rate below 95% (top performers achieve 95-99%) ✅ Billing staff turnover 2+ times in past year (industry average is 18-24 months) ✅ Cost to collect exceeds 8% of collections (benchmark is 3-5%) ✅ Planning significant growth (adding 3+ providers or new locations) ✅ High-complexity specialty (surgery, pain management, oncology have 25-40% higher denial rates per specialty data)
What Research Shows About RCM Outsourcing Results:
According to Black Book Market Research’s 2025 RCM Customer Satisfaction Survey:
Practices outsourcing RCM see average 12-18% improvement in net collections
Denial rates decrease by average of 35% within 6 months
Days in A/R improve by average of 12-15 days
Internal billing costs decrease by 25-40%
Evidence-Based RCM Partner Selection Criteria:
Based on HBMA best practices and MGMA vendor selection guidelines:
🔹 Demonstrated Performance Metrics: Request actual client performance data, not promises 🔹 Transparent Pricing: Clear percentage or per-claim pricing with no hidden fees 🔹 Certified Coding Staff: Certifications with specialty-specific experience 🔹 Technology Platform: Real-time Reports access to all KPIs 🔹 References: Verifiable references from practices similar to yours 🔹 Flexible Contracts: Reasonable trial periods, not multi-year lock-ins 🔹 Compliance Expertise: Demonstrated knowledge of OIG, CMS, and payer regulations
📊 Industry Benchmarks: Where Does Your Practice Stand?
Based on 2025 MGMA Revenue Cycle Benchmarking Report and HFMA Performance Standards:
Where do you stand relative to these research-based benchmarks? 📍
🎯 Your Evidence-Based 48-Hour Action Plan
Don’t let this be another article you read and forget. Here’s your research-backed action plan:
Today (Next 2 Hours):
Hour 1: Assess Your Current State ☑️ Complete the 5-minute self-assessment above ☑️ Pull your current metrics: denial rate, Days in A/R, net collection rate ☑️ Compare your numbers to industry benchmarks ☑️ Calculate your estimated annual revenue leakage using these formulas:
Small Practice: Annual Revenue × 0.12 = Estimated Loss
Medium Practice: Annual Revenue × 0.14 = Estimated Loss
Large Practice: Annual Revenue × 0.15 = Estimated Loss
Hour 2: Prioritize Actions ☑️ Schedule 60-minute meeting with billing manager for this week ☑️ Identify your single biggest gap relative to benchmarks ☑️ Review your current technology stack (PM system, scrubbing tools, verification tools) ☑️ List top 3 action items based on highest potential ROI
This Week (Next 5 Days):
☑️ Day 1-2: Request performance reports from your PM system (or RCM vendor if outsourced) ☑️ Day 3: Meet with billing team to review findings and identify root causes ☑️ Day 4: Research technology solutions for your biggest gap (verification, scrubbing, reporting) ☑️ Day 5: Create 90-day improvement plan with specific metrics and timelines
This Month (Next 30 Days):
☑️ Implement ONE major process improvement (based on highest ROI from research) ☑️ Establish weekly revenue cycle review meetings (30 minutes every Tuesday) ☑️ Train staff on new workflows and expectations ☑️ Baseline your current metrics for comparison ☑️ Decide whether you need external audit or RCM support
📚 References & Research Sources
American Medical Association (AMA)
National Health Insurer Report Card, 2025
CPT Code Updates and Guidelines, 2026
Physician Practice Benchmark Survey, 2025
Medical Group Management Association (MGMA)
Revenue Cycle Benchmarking Report, 2025
Financial Performance Survey, 2025
Cost and Revenue Survey Data, 2025
Healthcare Financial Management Association (HFMA)
Healthcare Billing & Management Association (HBMA)
Workforce Trends and Turnover Study, 2025
RCM Best Practices Guidelines, 2025
Society for Human Resource Management (SHRM)
Cost-per-Hire Benchmarking Study, 2025
Employee Turnover and Retention Research
American Health Information Management Association (AHIMA)
Clinical Documentation Improvement Research
Health Information Management Best Practices
Journal of Medical Practice Management
Peer-reviewed studies on revenue cycle optimization
Coding accuracy and compliance research
American Academy of Family Physicians (AAFP)
Primary Care Billing and Coding Research
Practice Management Resources and Guidelines
National Correct Coding Initiative (NCCI)
Medicare Policy Manual
Coding Methodology and Guidelines
Methodology Note: All statistics, benchmarks, and case study parameters referenced in this article are derived from published research, industry reports, and peer-reviewed studies from the sources listed above. Financial impact estimates are calculated using median practice size data from MGMA surveys and applying published denial rates, collection rates, and error percentages from the referenced studies.
✍️ About RCAceSolutions
We’re a revenue cycle management partner dedicated to helping healthcare practices eliminate preventable revenue loss through systematic process improvement, automation, and expertise.
Our Approach: We believe every practice deserves to capture 100% of the revenue they’ve rightfully earned. Our services are built on published best practices from MGMA, HFMA, AAPC, and industry research—not promises, but proven methodologies.
Our Commitment: We’re actively building our client base, which means we’re highly motivated to deliver exceptional results and earn your long-term partnership. We succeed only when you succeed.
Our Promise: Transparent performance reporting, research-backed strategies, and measurable results within 90 days.
Your Revenue Growth Partner, The RCAceSolutions Team 💙
💬 Let’s Start a Conversation
Are you experiencing revenue challenges? We’d love to understand your specific situation.
Medicare Advantage denial rework: $47.77 per claim
Commercial payer denial rework: $43.84 per claim
🚀 And It’s Getting Worse
Medicare Advantage denials increased nearly 56% year over year
Commercial plan denials rose over 20%
AI-driven claim reviews are denying claims at unprecedented scale
🤖 Why Denials Are Hitting Practices Harder Than Ever
The denial surge is driven by a perfect storm of industry forces:
🔹 Increasingly Complex Payer Policies
Frequent policy changes, stricter medical necessity criteria, and inconsistent prior authorization requirements create constant risk.
🔹 AI-Powered Claim Reviews
Payers now use automated systems to deny claims in seconds—often without clinical context. Some reports show hundreds of thousands of claims denied in weeks, many later deemed inappropriate.
🔹 Administrative & Eligibility Errors
Outdated insurance data, demographic mismatches, and missed authorizations trigger thousands of avoidable denials daily.
🔹 Documentation & Coding Gaps
Up to 49% of claims are impacted by routine documentation or coding issues—problems that require prevention, not rework.
🧠 The Hidden Costs Destroying Practice Performance
Denials hurt far more than revenue:
💰 Cash Flow Disruption: Increased AR days and delayed reimbursements
🧑💼 Staff Burnout: Endless rework, appeals, and payer follow-ups
🩺 Reduced Patient Focus: Less time spent on patient care
RCAceSolutions is a trusted revenue cycle management partner specializing in denial prevention, analytics, and expert-led resolution. We combine advanced technology with seasoned human expertise to help healthcare practices protect revenue, reduce administrative burden, and achieve long-term financial stability.
📩 Contact us today to transform your revenue cycle into a competitive advantage.
📚 References
Journal of Managed Care & Specialty Pharmacy – Claim Denial Trends
American Medical Association (AMA) – Prior Authorization Impact Studies
MGMA – Medical Practice Financial Indicators
CMS – Medicare Advantage Claims & Appeals Data
HFMA – Revenue Cycle Benchmark Reports
Change Healthcare – Denials & Cost of Rework Analysis
America’s healthcare providers are facing a financial crisis hiding in plain sight. While you’re focused on delivering exceptional patient care, an operational storm is draining your cash flow and suffocating your revenue cycle.
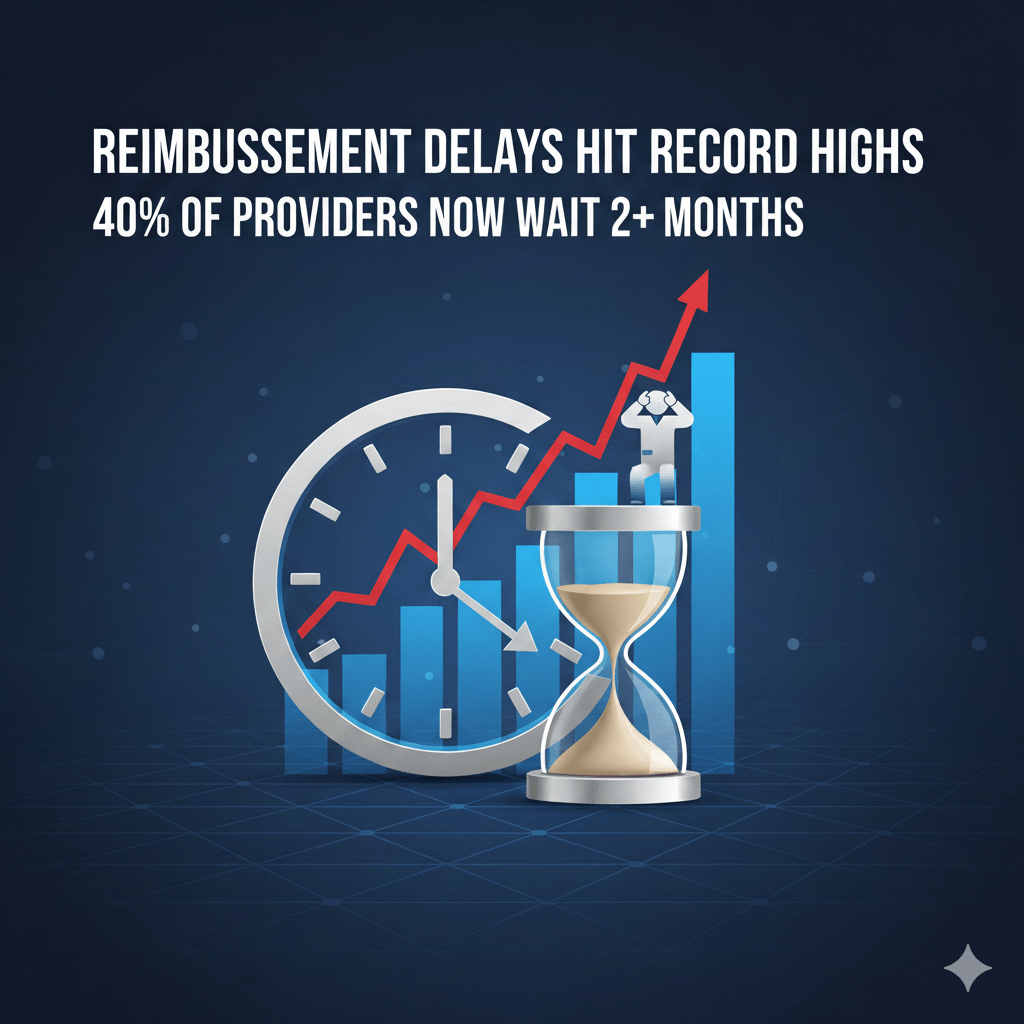
Payment delays have reached historic highs—and the consequences are hitting practices harder than ever.
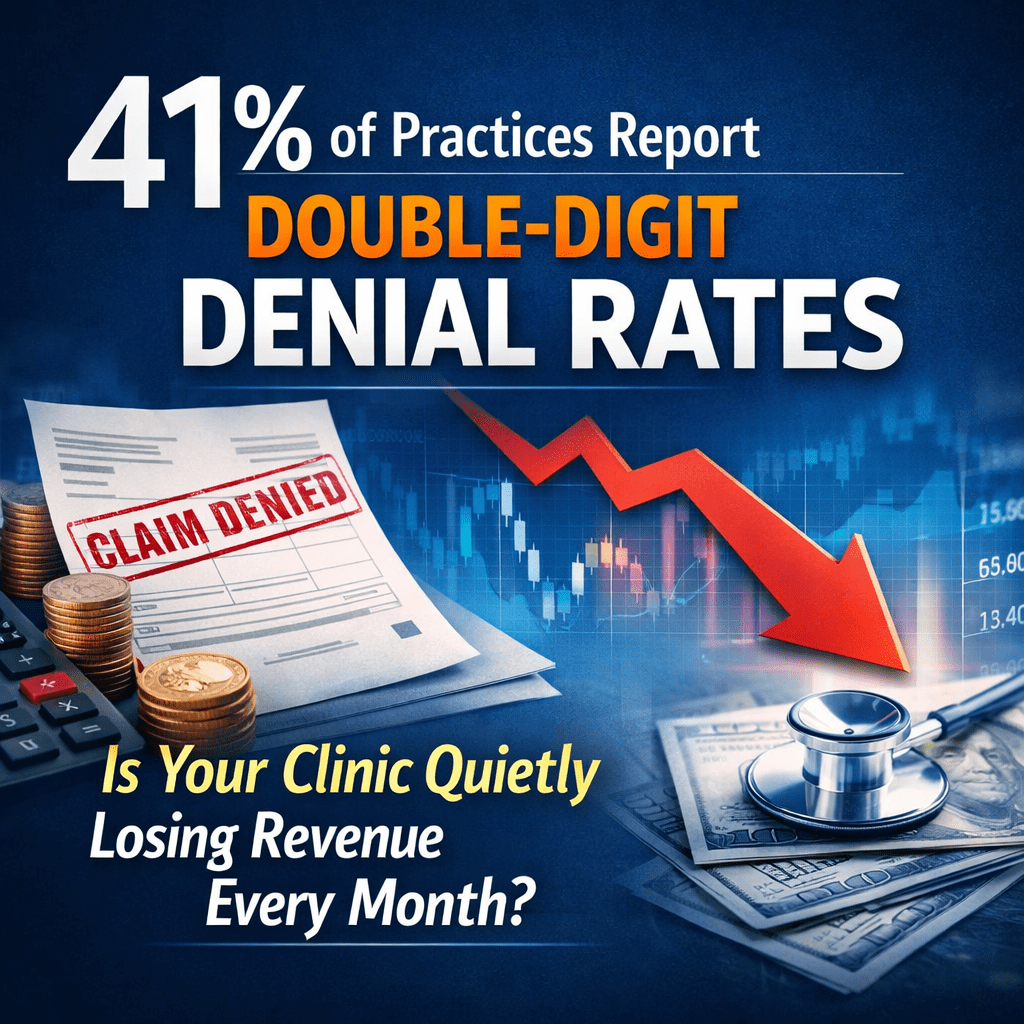
📉 47 days → average wait for reimbursement ⏳ 40% of providers → waiting 60+ days 📑 41% → facing denial rates of 10% or more
These aren’t just industry statistics. They’re direct threats to your practice’s financial stability.
⚠️ The Perfect Storm: Why Delays Are Accelerating
Multiple pressures have collided to create the most hostile reimbursement environment in years.
1️⃣ Denial Rates at Crisis Levels
Denials now steal millions from healthcare organizations each year.
Meanwhile, Requests for Information (RFI) denials rose 10% in 2024—affecting 3.5% of all gross revenue billed.
Every denied claim represents lost time, lost revenue, and lost staffing capacity.
2️⃣ Prior Authorization: The 12-Hour Weekly Burden
Physicians now complete an average of:
📄 43 prior authorizations per week ⏱️ Consuming 12 hours of administrative time ❌ With 25% of authorizations often denied
Administrative overload is pulling clinicians away from patient care and fueling burnout across every specialty.
3️⃣ Medicare Cuts Tighten the Squeeze
Just as operating costs rise, reimbursements continue falling.
2.83% cut from CMS in the 2025 Physician Fee Schedule
6.43% net impact when combined with cost inflation
Hospitals receive $0.83 for every $1 spent on Medicare patients
Inflation: 14.1% (2022–2024)
Medicare inpatient rate increase: 5.1%
This imbalance is not sustainable—and cash flow is absorbing the hit.
4️⃣ Cash Reserves Are Collapsing
The financial buffer many providers rely on is evaporating.
💸 Median health system cash reserves fell 28% 📉 From 173 days → 124 days in just 18 months 🕒 1 in 4 payments to small providers arrives late
For many practices, the margin for error has disappeared entirely.
💥 The Hidden Costs: Beyond the Balance Sheet
Even before revenue loss shows up in the ledger, delays trigger operational damage:
🔥 Staff Burnout & Turnover
Billing teams spend endless hours resubmitting claims
80%+ of denials are preventable
But fewer than 50% are appealed
Overworked teams create new errors, expanding the cycle of loss.
👎 Declining Patient Experience
Cash flow issues force tough decisions:
Delayed equipment upgrades
Reduced staff hours
Longer patient wait times
Meanwhile, 78% of providers fail to collect $1,000+ patient balances within 30 days.
⏳ Permanent Revenue Loss from Aging Claims
Claims older than 90 days rapidly lose collectability. Yet many practices lack the follow-up infrastructure needed to recover them.
🔍 Where Claims Get Stuck: The Root Causes
Understanding the bottlenecks is the first step toward fixing them.
❗ Coding Errors & Documentation Gaps
With 420 CPT updates between 2024–2025, coding accuracy is more fragile than ever.
❗ Insurance Verification Failures
Lapsed or incorrect coverage = automatic denial …often weeks after the encounter.
❗ Weak Follow-Up Systems
RFI denials take 60–120 days to resolve—even though 89% eventually result in zero revenue loss. Cash flow suffers long before the cycle ends.
❗ Manual Processes That Don’t Scale
Only 31% of providers use automation in revenue cycle operations. Manual workflows = more errors, slower reimbursement, and skyrocketing overhead.
🚀 How RCAceSolutions Transforms Your Revenue Cycle
In a landscape where delays are worsening, RCAceSolutions helps you regain control, stabilize cash flow, and accelerate payments.
⚡ Expert Accelerated Claims Processing
RCAceSolutions delivers a higher standard of speed, accuracy, and compliance through expert-led and technology-enhanced claims processing. Our approach eliminates the bottlenecks that slow reimbursements and cause costly delays.
🔍 What Our Expert Team + Intelligent Automation Achieve for You:
Real-Time, Automated Eligibility Verification Prevent eligibility-related denials before they occur with instant verification completed before patient encounters, eliminating downstream claim rework.
AI-Enhanced Coding With Expert Oversight Our coding intelligence automatically updates CPT/ICD changes, flags discrepancies, and provides expert-reviewed corrections to ensure precision and regulatory compliance.
First-Pass Clean Claim Precision Every claim undergoes multi-layer QA, payer-rule validation, and error-proofing—resulting in consistently high clean-claim rates and dramatically fewer resubmissions.
Expert Playbooks for Every Payer We apply payer-specific rules, patterns, and historical behavior insights to structure claims for maximum acceptance on the first submission.
Streamlined Documentation Capture Automated pulling, matching, and mapping of required documents ensures clean, complete submissions—reducing missing-info denials and RFI delays.
🛡️ Denial Prevention & Strategic Appeals
Stop denials before they occur—and overturn the ones that do.
🔍 Predictive Denial Analytics
📌 Root Cause Mapping
✉️ Expert, documentation-backed appeals
This shifts your team from reactive chaos to proactive prevention.
📨 Prior Authorization Optimization
End the 12-hour, physician-draining workload.
👥 Dedicated authorization specialists
🕑 Proactive submissions
📊 Real-time status tracking
Your clinicians return to doing what they do best—caring for patients.
💰 Cash Flow Acceleration
A more efficient revenue cycle means:
Fewer claims stuck in A/R
More revenue captured
Faster, more predictable payment cycles
Clients commonly see measurable financial lift in 90 days.
📈 Results You Can Expect
Partnering with RCAceSolutions achieve:
30–40% reduction in claim denials
25–35% decrease in days in A/R
15–25% improvement in first-pass clean claims
20–30% increase in staff productivity
Greater cash flow stability and forecasting accuracy
✨ Beyond the Numbers
The real transformation is operational:
Clinicians spend less time on administrative work
Billing teams focus on strategy, not busywork
Leadership gains visibility through real-time dashboards
Decisions become data-driven instead of reactive
This is what a modern revenue cycle should look like.
🏁 The Path Forward: From Crisis to Stability
The reimbursement crisis will not improve on its own. But your practice doesn’t have to absorb the damage.
You can: ❌ Continue fighting rising delays, denials, and shrinking margins or ✅ Partner with specialists who help you reverse the trend and stabilize your financial future
📞 Your Next Step
RCAceSolutions provides a Complimentary Revenue Cycle Assessment that uncovers:
Hidden bottlenecks
Preventable revenue leaks
Denial trends
Financial projections
Recommended fixes customized to your specialty
⚡ Minimal time required ⚡ Zero obligation ⚡ High-value insights from day one
While you’re focused on caring for patients, your revenue cycle might be quietly collapsing — and the consequences are now too big to ignore.
A Crisis That’s Already Closing Doors
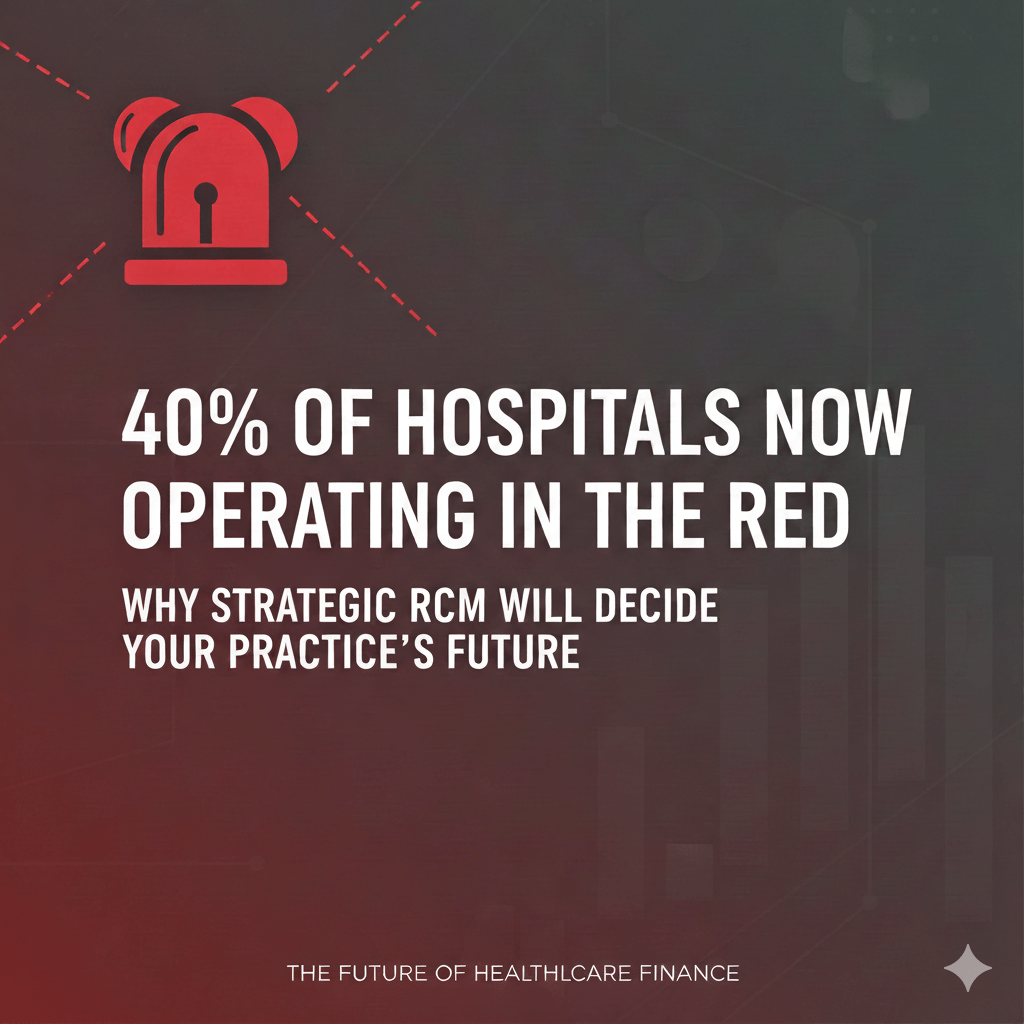
2024 exposed a disturbing truth: 40% of U.S. hospitals are operating in the red. And 2025 is continuing the trend — with 19+ hospital closures already impacting metro and rural communities alike.
Many believed: “It won’t happen to us.” Until payroll panic… unpaid claims… a critical closure notice…
The practices that survive aren’t the ones seeing more patients. They’re the ones capturing the revenue they’ve already earned.
The Three-Front Financial Attack Threatening Your Practice
📈 1️⃣ Escalating Costs Outpacing Reimbursements
General inflation jumped 12.4% (2021–2023) — yet reimbursement adjustments lag far behind.
Operational costs keep climbing:
Drug expenses: +12% YoY
Supply costs: +11% YoY
Purchased services: +10% YoY
Labor costs remain historically high
Your expenses are accelerating. Your revenue? Not so much.
🚫 2️⃣ Claim Denials at an All-Time High
Initial denial rates surged to 11.8% in 2024 — nearly 1 in 9 claims.
More alarming:
41% of providers report >10% denial rates
Medicare Advantage denials hit 17%
Medical necessity denials: +5% YoY
Total denial burden: ≈ $260B lost annually
❗ Even a 1% increase in denials = ≈ $2M in lost revenue per 100-bed hospital
💸 3️⃣ Patient Balances Are Becoming Uncollectible
High deductibles = low collections:
Insured patient collections dropped from 37.6% → 34.5%
That’s $3 less per $100 owed — multiplied across thousands of encounters
Patients owe more… and are paying less.
Why “Working Harder” Is No Longer Working
Your team is already stretched to capacity. But more effort in broken systems only accelerates burnout.
The problem isn’t productivity — it’s preventable revenue leakage.
🩸 You’re providing the care… but not collecting the revenue.
The Solution: Strategic Revenue Cycle Management
RCM is no longer just billing — It is your Financial Survival System.
When properly implemented, Strategic RCM: ✔ Cuts denials before they happen ✔ Accelerates cash flow ✔ Improves net collections ✔ Lowers administrative burden ✔ Enhances patient satisfaction ✔ Strengthens compliance ✔ Protects long-term viability
💡 Introducing The RCM ACE System™
Analyze → Capture → Elevate
A proven 3-phase framework tailored to healthcare providers:
1️⃣ Analyze → Reveal Hidden Revenue
Identify failure points from front desk to payer payment:
Eligibility gaps
Coding errors
Missing charge capture
Delayed submissions
2️⃣ Capture → Stop Revenue Leakage
Optimize workflows + technology so every service = revenue collected:
Clean claim creation
Predictive denial prevention
A/R and appeals optimization
3️⃣ Elevate → Sustain Performance
Real-time insights and compliance-first improvement:
Financial dashboards
Staff enablement
Continuous automation
This is the difference between surviving and scaling.
📊 How Do You Measure Up?
RCM Performance Scorecard (Quick Check)
KPI
Healthy
At Risk
Critical
Initial Denial Rate
<5%
6–10%
10%
Days in A/R
<40
41–60
60
Net Collection Rate
95–100%
90–94%
<90%
Patient Collection Rate
40%
30–39%
<30%
If you have even one item in the red — your financial stability is already compromised.
🤝 Why Practices Partner With RCAceSolutions
We don’t just theorize RCM. We fix it.
Immediate Impact (First 90 Days)
Recover aged A/R others wrote off
Prevent denials before they occur
Accelerate payments and cash flow
Long-Term Sustainability
Front-end accuracy → clean claims
Mid-cycle precision → correct billing
Back-end follow-through → full payments
Performance Gains We Deliver
📈 Typical results within 6–9 months:
35–50% reduction in denials
20–40% boost in first-pass acceptance
25–35% faster reimbursement
15–25% higher net collections
10–20 fewer A/R days
The Cost of Doing Nothing
Revenue leakage is silent and deadly:
🩸 Every day without RCM improvement = lost revenue you can never recover.
Closure doesn’t happen overnight. It happens claim by claim… until it’s too late.
Your Move Determines Your Future
The gap between financially thriving and failing organizations is widening — fast.
Those who win don’t work harder. They collect smarter.
Your Next Step: Take Control
🎯 Get Your Free RCM Performance Map™
A 30-minute assessment that reveals: ✔ Exact revenue you’re losing ✔ Top 3 areas to fix immediately ✔ A prioritized roadmap to improvement
No disruption. No obligation. Limited spots each month.
A decisive wake-up call for providers facing escalating denials, delayed cash flow, and administrative overload
📌 Why This Matters Right Now
Healthcare practices across the U.S. are being financially blindsided:
💸 $262B lost annually due to revenue cycle inefficiencies ⏳ Reimbursements now take 2–7 months to collect 👎 Denials increasing — 11.8% average rate and rising 🏥 Healthcare bankruptcies at 3-decade highs
This isn’t a hypothetical threat. It’s a countdown.
👉 Your revenue crisis is reversible — but only if you take control now.
⚠️ The Breaking Point Has Arrived
Dr. Sarah Chen just experienced her third straight month of six-figure denials. After nearly two decades serving patients in Philadelphia, a terrifying reality hit:
If the checks don’t come soon — she will have to shut down.
She’s not alone. Thousands of practices are quietly bleeding out while payers automate denials at scale.
🔥 The Three Forces Destroying Practice Profitability
1️⃣ The Denial Epidemic 💥
65% of denied claims are never resubmitted
Reworking a denial costs $25–$181
1 in 10 providers lose $2M+ annually to preventable denials
Denials aren’t a billing problem — they are the #1 cause of hidden revenue loss in healthcare.
2️⃣ Slower Payments = Cash Flow Chokehold 🧊
40%+ wait 60+ days for reimbursement
Medicaid claims often stretch beyond 180 days
Nearly 14% of all claims are overdue
Rent, payroll, and medical supply costs do not wait.
3️⃣ Administrative Burden Is Devouring Your Profit 🧾
Denial rework cost per claim up 30%+ YoY
Billing teams stuck in reactive firefighting mode
11–40% RCM turnover rate fueling expensive errors
This is not inefficiency — this is profit erosion built into the system.
❌ Why Traditional RCM Isn’t Working
What You’re Doing
Why It’s Failing
Adding staff
ncreases cost without fixing root causes
Upgrading software
Many tools create more manual work
Relying on experience
Turnover destroys institutional knowledge
Playing by payer rules
AI payers deny faster than humans can respond
Payers are evolving. Your RCM Strategy must evolve faster.
📉 Are These Bankruptcy Warning Signs in Your Practice?
✔ Declining days cash on hand ✔ Equipment replacements put on hold ✔ Payroll panic every month ✔ Considering scaling back services ✔ Billing team constantly behind ✔ Providers fixing coding issues after hours
If this feels familiar — your financial risk is already high.
💡 The Solution: Transforming Chaos Into Predictable Revenue
RCAceSolutions delivers Revenue Cycle Mastery, not temporary relief.
We engineer predictable profit — and eliminate unnecessary loss.
🛡️ The RCAceSolutions 3-Pillar System for RCM Excellence
1️⃣ Denial Prevention 🔍
We stop revenue loss before it occurs:
AI pre-submission scrubbing 🤖
Next-gen eligibility & authorization verification
Payer intelligence database that learns & adapts in real time
📈 Result: 47% reduction in denials in the first 90 days
2️⃣ Accelerated Revenue Realization ⚡
We shorten your payment cycle end-to-end:
95%+ clean claim rate target
Proactive payment monitoring
High-winning appeal execution
📉 Result: Days in A/R drop from 70 → 30–35 days
3️⃣ Full Revenue Cycle Optimization ♻️
We rebuild efficiency across the entire workflow:
End-to-end process mapping
Staff augmentation + expert training
Integrated tech that actually works
🚀 Result: +15–30% net collections ⏱️ 40–50% less administrative workload
🧭 Implementation Roadmap
Phase
Timeline
Primary Outcome
Rapid Assessment
Weeks 1–2
Revenue leakage visibility
Quick Wins
Weeks 3–6
Immediate cash recovery
System Optimization
Months 2–6
Stability + scalability
Continuous Excellence
Ongoing
Predictable revenue growth
🆚 The Cost of Waiting vs. Taking Action
For a $3M practice (industry averages):
Inaction
RCAceSolutions Partnership
$250K–$600K annual revenue loss
400–700% ROI in 12 months
Administrative overload
40–50% workload reduction
Cash flow instability
Predictable monthly collections
Rising burnout & turnover
Strong morale & retention
📍 The math makes the decision for you.
⭐ Why Choose RCAceSolutions
🧠 Certified healthcare RCM experts 🤖 AI-enhanced systems + expert human oversight 📊 Real-time revenue transparency 🔄 Payer policy monitoring & rapid adaptation 🎯 Success-based partnership — we win when you win
💬 The Smart Questions Executives Ask
⏱️ How fast do we see results? → 30–60 days noticeable improvement
🛠️ Will operations get disrupted? → No — efficiency improves immediately
🔍 Are we too big or too small? → Scalable from solo to multi-location systems
🚀 Urgent Call to Action
Every additional day: 🔻 Revenue lost 🔻 Denials stack up 🔻 Competition advances
You deserve every dollar you’ve earned. Let’s make sure you get it.
📞 Schedule Your Free RCM Revenue Recovery Assessment
The U.S. healthcare system is facing a revenue crisis unlike anything in the last two decades. Administrative labor shortages have driven costs up by $42.5 billion, while claim denials have skyrocketed to $260 billion a year, choking cash flow for practices of all sizes. Traditional in-house billing teams—once the backbone of practice operations—can no longer keep pace with payer complexity, technology demands, and rising turnover.
This article breaks down why the old model is failing, what it’s costing your organization, and how modern RCM solutions are helping practices recover $210K–$360K in annual revenue while reducing denials to under 5%.
The Hidden Cost That’s Draining Your Practice Dry
Every morning, Dr. Sarah Chen walks into her thriving family practice in suburban Texas—twenty exam rooms, five physicians, and a month-long waitlist. By all measures, the clinic is a success… except for one paralyzing issue:
Her billing department is collapsing.
Despite competitive compensation, her three-person billing team is overwhelmed. Claims backlogs grow. Denials stack up. And in just one month, $47,000 in legitimate reimbursements vanished simply because the team couldn’t keep up.
Dr. Chen’s story isn’t unique. It’s a preview of a nationwide crisis that’s costing practices $42.5 billion—and growing every quarter.
The Numbers Don’t Lie: A System in Collapse
The Staffing Desert
88% of healthcare executives report critical biller and coder shortages
3.2M billing professionals expected short by 2026
58% of practices say staffing is their #1 challenge (surpassing expenses and regulations)
Healthcare will face a 100,000+ worker deficit by 2028
The Financial Hemorrhage
Claim denials rose to 11.8% in 2024 (up from 10.2%)
Payers now deny $260B annually
Providers spent $10.6B overturning incorrect denials in 2022
Hospitals lose $5M annually from denials (~5% of net patient revenue)
The Productivity Crisis
34% of providers can’t hire coders
1 in 3 can’t fill scheduler or prior-auth roles
Claim rework takes 12–15 minutes per claim
A/R > 90 days now exceeds 35% (historical benchmark: 20%)
If You’re Seeing These Symptoms, Your Revenue Cycle Is Already Failing
Denials above 10%
A/R > 90 days beyond 30%
Claims aging 15+ days
Back-office turnover above 20%
Physicians complaining about administrative load
Hours spent daily on eligibility & prior auth
Cash flow unpredictability affecting payroll or growth
Two or more of these = early-stage revenue cycle failure.
Why Your In-House Team Can’t Win This Battle
1. The Talent Drought Is Accelerating
Even as healthcare wages jumped 15.6%, practices still can’t compete with:
Hospitals offering 200–300% salary premiums
National health systems hiring remote billers
Turnover cycles every 12–18 months
A shrinking pipeline of qualified graduates
Training takes months. Replacements take longer. Claims don’t wait.
2. Payer Complexity Has Exploded
Today’s RCM environment is 5× more complex than it was pre-2020:
Prior auth volume up 43.9%
Medicare Advantage using AI to pre-deny
RFIs now 3.5% of total charges (worth $50B in denials)
Payers impose unique rules, documentation, and portals
A three-person team cannot manage this level of complexity.
3. The Burnout–Attrition Death Spiral
Burnout → Turnover → Errors → Denials → More Work → More Burnout
53% of providers cite burnout as the top workforce issue
Billing staff experience similar pressure
Each resignation costs $50K–$75K
This cycle destroys in-house teams from within.
4. Technology Gaps Are Killing Efficiency
Most practices remain manual while top performers automated years ago:
Fewer than 50% automate basic RCM tasks
76% of denials stem from preventable data errors
AI scrubbers catch errors manual review never will
Real-time eligibility verification still uncommon
High-performing competitors process 3–5× more claims per staff member.
5. The Hidden Cost of “Acceptable” Denial Rates
A “normal” 12% denial rate on $3M in charges means:
Impact
Amount
Total Denied
$360K
Permanently Lost
$165,600
Hours Wasted (Rework)
500–800 hours
Labor Cost
$22,500–$36,000
Total Annual Loss
$188K–$201K
That’s 6–7% of gross revenue gone.
Why Top-Performing Practices Are Outsourcing Their Revenue Cycle
What They’ve Discovered
Outsourcing to specialized RCM Partners delivers:
16.9% reduction in billing costs
11.6% increase in revenue
Denials below 5%
30–40% reduction in A/R days
Staff freed to focus on patient care
This is not a minor upgrade—it’s a structural transformation.
What Makes RCAceSolutions Different
U.S.-trained Medical Billing and Revenue Cycle Management expert teams (no low-skill offshore risks)
Dedicated payer-specialized teams
Sub-5% denial rate performance guarantee
Weekly KPI reviews
Direct payer escalation specialists
AI + human hybrid model
Zero hiring, training, or turnover costs
This becomes your competitive moat.
How RCAceSolutions Solves What In-House Teams Cannot
1. Unlimited Scalability Without Hiring
Certified billers with years experience
No hiring, training, or HR burden
Go-live in 2–3 weeks
2. Expert Knowledge of All Payer Rules
MA, Medicaid, and commercial specialization
Daily rule updates
Proprietary payer intelligence
30–40% fewer preventable denials
3. RCM Expert Advanced — Included
Advanced Claim Intelligence
Smart Eligibility Precision
Expert Denial Pattern Detection
RCM Root-Cause Command Center
(Technology worth $300K+ annually—included.)
4. Aggressive Denial Recovery
100% of overturnable denials appealed
Payer escalation to leadership
65%+ overturn success
5. Full Transparency & Accountability
Real-time dashboards
Weekly reporting
Quarterly reviews
Contractual performance guarantees
The RCAceSolutions 90-Day Transformation
Phase 1: Assessment (Days 1–14)
Full audit
Denial pattern analysis
Workflow mapping
Tech integration review
ROI projection
Phase 2: Transition (Days 15–30)
Zero-disruption takeover
Backlog clearance
System integration
Staff alignment
Phase 3: Optimization (Days 31–90)
Denial prevention protocols
Automated workflows
Proactive payer management
Front-office training
Before vs. After: The 90-Day Snapshot
KPI
Before
After 90 Days
Denial Rate
12–18%
3–5%
A/R Days
45+
24–30
Clean Claims
70%
92–97%
Annual Revenue Impact
—
+7–12%
For a $3M practice, that means $210K–$360K in recovered annual revenue.
The Cost of Waiting (Every Month You Delay)
$15K–$40K lost
A/R grows 3–8 more days
Staff burnout intensifies
Denials compound
Growth stalls
Physician morale declines
Waiting is the most expensive decision.
The Future of Medical Billing
AI-driven payer denials rising
Regulatory demands expanding
Prior auth volumes increasing
Labor shortages worsening
Patient out-of-pocket responsibility growing
Traditional in-house billing will not survive these shifts. Modernization is no longer optional—it’s decisive.
Take Control of Your Revenue Cycle Today
At RCAceSolutions, we help healthcare organizations eliminate revenue leakage, reduce administrative burdens, and thrive even in the most complex payer environment.
We guarantee measurable improvements within 90 days.
Get Your Free Revenue Leakage Report
✔ Actual denial rate ✔ Revenue leakage calculation ✔ Payer performance breakdown ✔ 90-day projection ✔ ROI calculator
Your care is excellent. Your staff is compassionate. Your technology is cutting-edge.
Yet patients are leaving — and they’re not coming back.
The reason? Not what happens in the exam room. What happens when the bill arrives.
Here’s the reality: 67% of customers cut ties with a brand after a poor experience. In healthcare, that “experience” too often begins — and ends — with billing.
💸 The $125 Billion Problem Nobody Talks About
While providers focus on clinical excellence, a financial epidemic quietly drains revenue from practices nationwide. Poor billing practices cost U.S. doctors over $125 billion every year — about $5 million per provider.
Let’s put that in perspective:
80% of medical bills contain errors
45% of insured adults** received a bill they thought insurance should’ve covered
Bills above $10 K include an average $1,300 error
These aren’t just numbers — they’re patients who won’t return, trust that evaporates, and revenue that never comes back.
🚪 The Patient Retention Crisis
36% of patients switched healthcare providers in the past two years. That means more than one in three of your patients are already looking elsewhere.
And the loyalty cliff is steep:
Only 43% of patients stay with their original doctor after five years
Physicians lose roughly half their patient base every five years
For new patients, there’s just a 5–20% chance of a second visit
The financial toll? The average cost of losing one patient is $243 — not including bad reviews, lost referrals, or reputation damage.
❤️ What Patients Actually Want (And Why Billing Is Part of Care)
When patients describe loyalty drivers in healthcare, two stand out equally: 1️⃣ Caring, compassionate clinicians 2️⃣ An easy, transparent billing experience
Yes — billing ranks alongside bedside manner.
Why Patients Leave:
Billing Complexity: 70% of patients say confusing bills destroy trust.
Unexpected Charges: 1 in 5 say surprise bills are their #1 frustration.
Lack of Transparency: 54% blame “affordability barriers” for reduced access, but 32% say flexible payment options restored it.
Provider Switching: 65% would switch to a provider with easier payment experiences.
Bottom line: when billing feels opaque, patients feel betrayed.
⚠️ The Hidden Cost: When Billing Errors Become Health Risks
Billing mistakes don’t just hurt finances — they hurt health.
60% of patients facing coverage denials report delayed care
47% say their condition worsened because of it
Every inaccurate bill risks not just payment — but the patient’s wellbeing. This isn’t a back-office issue anymore. It’s a clinical issue.
Because when billing fails, care fails.
🔄 Enter the Patient-First Billing Model
Traditional billing treats patients as debtors. Patient-First Billing treats them as partners.
1️⃣ From Reactive → Proactive
Old Model: Send bill. Wait. Chase payment. Send to collections. New Model: Explain coverage upfront, offer cost estimates, and provide payment options before treatment.
2️⃣ From Complexity → Clarity
Old Model: Codes, jargon, endless pages of confusion. New Model: Plain language, itemized charges, simple online formats.
3️⃣ From One-Size-Fits-All → Personalized Solutions
Old Model: “Pay in 30 days or else.” New Model: Flexible plans, digital payments, financial counseling, and empathy.
The Patient-First Billing Model doesn’t just streamline operations — it rebuilds trust.
🚀 The RCAceSolutions Advantage: Turning Billing Into a Competitive Edge
At RCAceSolutions, we help practices transform their billing from a source of patient frustration into a driver of loyalty and revenue.
Here’s how:
1. Error Elimination Through EXPERT DRIVEN TEAM
Our Expert powered claim-scrubbing ensures clean claims the first time. ✅ Fewer denials. ✅ Faster payments. ✅ Happier patients.
2. Transparent Patient Communication
We deploy upfront cost estimation tools that eliminate billing surprises. ✅ Clear expectations. ✅ Fewer disputes. ✅ Higher trust.
3. Flexible Payment Solutions
From mobile payment portals to automated plans, we help you meet patients where they are financially. ✅ More access. ✅ More retention.
4. End-to-End Revenue Cycle Management
From verification to collections, we manage every step precisely. ✅ You focus on care. ✅ We handle your revenue integrity.
5. Data-Driven Optimization
We deliver analytics that pinpoint revenue leaks and patient friction points — so you can fix what matters fast. ✅ Smart decisions. ✅ Continuous improvement.
🧬 Why Billing Is Now a Clinical Issue
A patient can receive world-class care… But if the bill is wrong, confusing, or unexpected — that’s all they remember.
The trust you built in the exam room disappears the moment the statement arrives.
Because when patients stop trusting your billing, they stop trusting your care. They delay treatment. Skip follow-ups. Or simply leave.
In modern healthcare, billing is no longer administrative — it’s relational.
👩⚕️ Different Generations, Different Expectations
Each generation defines a “good billing experience” differently:
Millennials & Gen X: Want mobile payment portals, text notifications, and instant transparency.
Baby Boomers: Want personal communication and paper statements they can understand.
A Patient-First Billing Model meets both where they are — combining digital convenience with human empathy.
🏆 Your New Competitive Advantage: Billing as Marketing
Clinical excellence is the baseline. What truly differentiates today’s providers is the total patient experience.
Here’s why your billing system is now a marketing asset:
📈 Track patient satisfaction metrics 📉 Analyze revenue cycle performance 🔁 Refine and scale what works
Outcome: Continuous improvement and long-term retention growth.
🧾 The Bottom Line
With over 100 million Americans carrying $220 billion in medical debt, patients are more financially anxious — and billing-sensitive — than ever.
The practices that thrive won’t just deliver excellent care. They’ll master financial empathy.
Because every bill is a story. Every statement is a moment of truth. Every payment interaction is a chance to rebuild — or destroy — trust.
The question isn’t whether you can afford to implement Patient-First Billing. The question is whether you can afford not to.
🤝 Partner With RCAceSolutions: Where Patient Trust Meets Financial Strength
RCAceSolutions is redefining how healthcare organizations manage revenue and relationships — through Patient-First Billing that delivers measurable results.
We provide:
End-to-end RCM management
Expert driven billing accuracy tools
Transparent communication systems
Flexible digital payment platforms
Real-time analytics & performance dashboards
Dedicated RCM specialists who treat your patients like their own
You gain: ✅ Faster, more accurate payments ✅ Fewer denials and disputes ✅ Happier, returning patients ✅ Stronger cash flow and staff efficiency
💬 Let’s Turn Your Billing Into a Loyalty Engine
You don’t need another vendor. You need a partner who understands that every invoice is a relationship.
Your clinic treated 47 patients yesterday. Your doctors delivered exceptional care. Your staff worked overtime to keep things running smoothly.
And yet—somewhere between care and collections—thousands of dollars quietly disappeared.
Denied claims. Coding errors. Administrative bottlenecks. These silent leaks are bleeding practices dry, and they’re far more common than you think.
You’re not alone—and you’re not powerless. That’s why 56% of healthcare providers have already begun outsourcing non-core functions like Revenue Cycle Management (RCM) to stop revenue loss, stabilize cash flow, and reclaim control of their financial health.
The real question isn’t if your practice is losing money. It’s how much—and how fast you can stop it.
📊 The $19.7 Billion Wake-Up Call
Let’s talk about the elephant in the exam room: Healthcare providers collectively spent $19.7 billion in 2023 just fighting for payments they’ve already earned.
The denial crisis is no longer emerging—it’s accelerating:
🚨 From concern to catastrophe: Providers reporting increased denials jumped from 42% to 77% (2022–2024).
📈 Rising rejection rates: Initial claim denials now sit at 11.8%, up from 10.2% just a few years earlier.
💸 Money left unclaimed:65% of denied claims are never reworked, resulting in an average 3% revenue loss.
⚠️ The 5–10% danger zone: Even modest denial rates can erase billions in annual revenue.
For small and mid-sized practices operating on razor-thin margins, these aren’t statistics—they’re survival metrics.
The numbers don’t just tell a story—they’re a warning.
🧩 Why Top Healthcare Leaders Are Outsourcing RCM
The global RCM outsourcing market hit $27.8 billion in 2023 and is projected to soar to $102.9 billion by 2032 — growing at 15.2% CAGR. That’s not a trend. It’s a transformation.
🌪️ The Perfect Storm of Complexity
Modern healthcare providers are navigating a trifecta of challenges:
1. Regulatory Quicksand 🧾 Billing codes, payer rules, and compliance standards shift constantly—making in-house teams prone to costly errors.
2. The Staffing Crisis 👥 RCM turnover averages 11–40%, compared to a national average of 3.8%. Every departure means lost expertise, higher training costs, and operational delays.
3. Technology Overload 💻 Sophisticated RCM systems require heavy investment and expertise that smaller practices rarely afford to maintain.
4. Denial Management Expertise 🩺 Nearly 90% of denials are preventable, yet most practices never resubmit two-thirds of their claims. That’s recoverable revenue—left untouched.
Cost Efficiency: Outsourcing reduces the overhead of software, training, and staffing—freeing capital for patient care and growth.
🏥 Operational Advantages
Scalability Without Pain: Seamless adaptation as your practice grows.
Access to Cutting-Edge Tech: Automation and AI tools that can save the industry over $20B annually.
On-Demand Expertise: Instant access to certified coders, denial specialists, and compliance experts—without full-time overhead.
“Outsourcing RCM isn’t about cutting costs—it’s about creating financial resilience in a system designed to deny it.”
🧠 The Competitive Reality: Are You Falling Behind?
RCM outsourcing isn’t a “future option”—it’s already happening. By 2025, more than one-third (36%) of practice leaders plan to outsource or automate parts of their RCM operations.
While competitors scale and optimize, too many practices remain stuck in administrative quicksand. The difference? Focus. Those who outsource spend more time on patients and strategy—not paperwork and denials.
🚀 How RCAceSolutions Transforms Your Revenue Cycle
At RCAceSolutions, we don’t just manage claims—we engineer revenue excellence.
🩺 Our Proven Process
1. Comprehensive RCM Assessment
Identify revenue leaks and denial trends
Benchmark against industry leaders
Build a tailored improvement roadmap
2. Denial Prevention Architecture
Real-time eligibility checks
Automated claim scrubbing
Pre-authorization and AI-powered coding validation
3. Expert Claims Management
Certified coders ensure CPT/ICD-10 accuracy
First-pass claim submission success
Payer-specific compliance monitoring
4. Aggressive Denial Resolution
Root cause analysis and appeals strategy
Rapid resubmission and follow-up
Continuous learning to prevent recurrence
5. Technology-Driven Precision
Expert based analytics, predictive modeling, and dashboard visibility
Workflow automation for speed and accuracy
6. Transparent Partnership
Real-time Reports 📊
Regular performance reviews 📅
Dedicated account team 🤝
Scalable engagement models
💥 What This Means for Your Practice
Immediate Wins:
✅ Reduction in denial rates within 90 days ✅ Faster payment cycles and improved cash flow ✅ Lighter administrative burden for staff
Long-Term Impact:
🌱 Sustainable revenue growth 🏥 Freedom to focus on patient care 📈 Scalability that grows with your clinic 🛡️ Protection from regulatory volatility
🧮 The Cost of Doing Nothing
If your practice generates $2M in annual revenue:
3% loss from unworked denials → $60,000 gone
8% denial rate with 65% unresubmitted → $104,000 lost
Staff turnover and inefficiencies → $50,000+ hidden cost
That’s over $200,000 evaporating every year. Meanwhile, 54% of CFOs believe RCM outsourcing can boost productivity and stabilize margins.
Doing nothing is the most expensive decision you can make.
💼 The 56% Solution: Your Move
The 56% of healthcare providers already outsourcing RCM aren’t chasing a trend—they’re following the data.
They’ve realized that in today’s healthcare economy, specialized RCM expertise isn’t optional—it’s essential.
You Have Three Choices:
❌ Continue as-is and watch revenue quietly drain away
🧩 Build in-house (and absorb high tech and training costs)
🚀 Partner with RCAceSolutions and transform your revenue cycle in 90 days
The choice seems obvious.
📅 Take Action Today
🎯 Get Your Complimentary Revenue Cycle Health Assessment
We’ll help you:
Analyze denial rates and leakage patterns
Identify top 3 areas for immediate financial recovery
Provide a tailored roadmap for sustainable revenue growth
The silent leak draining healthcare profits — and the proven system that stops it cold.
By RCAceSolutions | Revenue Growth Partner
While you’re caring for patients, your revenue might be quietly bleeding out behind the scenes.
Every single week, $935 million disappears from the U.S. healthcare system — not from malpractice or payer cuts, but from something far simpler: preventable billing errors.
And the most alarming part? It’s happening in your practice before the first patient even arrives tomorrow morning.
⚠️ The $125 Billion Problem Nobody’s Talking About
Poor billing practices cost U.S. doctors $125 billion annually. For every dollar you earn, pennies are slipping through cracks you didn’t even know existed.
📊 The Numbers Don’t Lie:
💸 80% of medical bills contain errors — the industry “norm” you’re unknowingly competing against
📉 30% of insurance claims are denied on first submission
🏥 50% of denials stem from billing errors
⏱️ 77% of providers say it takes over a month to collect payment
💰 Average cost to correct each billing error: $120+
💡 Reality Check: Every minute you’re not addressing billing accuracy, your practice is losing operating capital that could fund staff, growth, or new equipment.
🧩 Where Revenue Goes to Die: The 5 Critical Failure Points
1️⃣ The Documentation Black Hole (44% of billing errors)
Incomplete or unclear clinical notes force coders to guess — and guesses don’t get paid.
Real Cost: The most common CPT code (99214) saw over $500M in improper payments in 2024 due to documentation gaps.
2️⃣ The Coding Catastrophe (63% of mistakes)
One wrong digit. One outdated modifier. One missed level of medical decision-making — and your claim is flagged or denied.
🩻 High-risk specialties like cardiology and orthopedics experience up to double the baseline error rate.
3️⃣ The Typo Tax (25% of errors)
A transposed number, misspelled name, or wrong insurance ID costs $25+ per resubmission and weeks of delay. ➡️ Small hospitals lose $187,000 annually from these “tiny” errors alone.
4️⃣ Patient Information Mismatches (22% of errors)
When patient demographics don’t align with payer records, claims bounce. Outdated cards, missing authorizations — each denial is care delivered but never paid for.
5️⃣ The Pre-Authorization Abyss
17% of insured Americans are denied coverage for doctor-recommended care. Why? Because pre-authorization steps were missed or mishandled. That means you’re providing care you’ll never be reimbursed for.
🩺 The Revenue Cycle Reality Check
Your revenue cycle isn’t just about billing — it’s about financial survival.
With one in four U.S. hospitals running on negative margins, every inefficiency is a step closer to red ink.
🔄 The 7-Stage Gauntlet Every Claim Must Survive:
🧾 Patient Registration — 15% of all errors
🧠 Insurance Verification — determines if you get paid at all
💳 Charge Capture — ensures every service performed is billed
🩻 Medical Coding — where 63% of errors occur
📤 Claims Submission — your one shot to get it right
💵 Payment Posting — reconcile owed vs. paid
🚨 Denial Management — costly rework of fixable mistakes
Each step is a potential revenue leak — and without automation and oversight, those leaks become floods.
💸 The Hidden Costs You’re Already Paying
Even before a claim is denied, the damage is done.
💰 Financial Strain
Delayed cash flow choking growth
Rising admin costs from rework
Lost underpayments that go unnoticed
🧑⚕️ Operational Impact
Staff spending 50%+ of their time fixing errors
Physicians pulled into billing issues
Manual workarounds for broken systems
💔 Patient Experience Damage
45% receive surprise bills they thought were covered
60% delay care due to billing confusion
Broken trust = lower retention
⚖️ Compliance & Legal Risks
HIPAA exposure through manual errors
Audit triggers from mismatched documentation
Potential fraud flags from recurring coding mistakes
🚀 RCAceSolutions: Stopping the Bleed Before It Starts
You don’t need another billing software. You need a system that thinks before it bills. That’s where RCAceSolutionscomes in.
🔍 1. Pre-Submission Error Interception
Our Expert powered audit tech catches errors before claims go out.
💡 If one clinic can recover nearly $1M — what could your practice reclaim?
💼 Measurable ROI You Can Track
Within 30 Days:
Full revenue cycle assessment
Immediate clean claim improvement
Within 90 Days:
20–30% faster payments
15–25% fewer denials
Within 6 Months:
25–40% fewer A/R days
$50K–$500K in recovered revenue
Ongoing:
Quarterly reviews
Continuous optimization
Real-time payer updates
🏁 The Choice Every Practice Faces
1️⃣ Do Nothing — keep losing 80% of your claims to errors. 2️⃣ Band-Aid Fixes — add more staff, more tools, more chaos. 3️⃣ Partner with RCAceSolutions — eliminate errors at the source and reclaim your revenue.
🌎 The Future of Healthcare Belongs to Revenue-Ready Practices
With patients now paying nearly 30% of costs out-of-pocket, billing accuracy isn’t optional — it’s survival. The winners in 2025 and beyond won’t just be great at medicine. They’ll be great at the business of medicine.
🩸 Take the First Step: Free Revenue Recovery Assessment
✅ 30-minute complimentary analysis ✅ Identify your top revenue leaks ✅ Quantify annual revenue loss ✅ Get a customized roadmap — no pressure, no pitch