In the modern healthcare landscape, patient financial responsibility is no longer a footnote—it’s a core revenue driver. With patient-pay portions skyrocketing from 10% to 30% of total practice income, the way you collect defines your survival.
Many clinics have turned to “Cold Automation” (AI agents and bots) to bridge the gap. This is a multi-million dollar mistake. While bots send reminders, they cannot handle complexity, confusion, or fear. The Hard Numbers of the Patient Pay Shift
30% of Revenue: The average portion of a practice’s income now coming directly from the patient’s pocket.
70% Friction Rate: Patients still receive paper bills they don’t understand, yet only 9% want to pay by check.
The 30-Day Cliff: Once a balance hits the 30-day mark, the likelihood of collection drops by over 50% without human intervention.
🤖 Why “Generic Automation” is Leaving Money on the Table
Automation is a tool, not a strategy. When a patient sees a $1,500 deductible they didn’t expect, an automated SMS is a nuisance—it’s an invitation to “Delete.”
Humans don’t just want a link; they want:
Clarity: An explanation of their EOB (Explanation of Benefits).
Empathy: Validation of their financial stress.
Flexibility: Real-time negotiation that a bot’s logic gate can’t compute.
The Growth Reality: Practices utilizing Human-Led, Empathetic Engagement recover 3x more than those relying solely on automated systems. Empathy isn’t just “nice”—it’s your highest ROI metric.
🤝 The “Empathy Factor”: Human-Led vs. Machine-Driven
Feature
Cold AI / Automation
RCA Human-Led Process
Response to Confusion
“Invalid Input” / Loop
Detailed Insurance Advocacy
Patient Sentiment
Transactional & Stressful
Relational & Supportive
Problem Solving
Rigid Logic Gates
Creative Payment Structuring
Bottom Line
High Churn / Low Recovery
High Retention / 3x Recovery
1. Patients are People, Not Accounts Receivable 👤
Healthcare is personal. When patients feel “heard” regarding their bill, they don’t just pay; they return. A human-led approach converts a “debtor” into a loyal advocate for your clinic.
2. Converting Frustration into Cash Flow 💸
An empathetic specialist can identify why a patient isn’t paying (Confusion? Timing? Error?) and solve it on the spot. Automation simply repeats the demand until the patient tunes out.
🚀 The RCAceSolutions Edge: Where Technology Meets Humanity
RCAceSolutions don’t abandon technology; we weaponize it to empower human connection.
Human-Centered Teams: Trained negotiators who speak the “language of the patient.”
Digital Integration: We use text and mobile pay as channels, but humans provide the conversion.
Front-End Clarity: We stop the bleeding before it starts with upfront cost education.
📈 Is Your Revenue Leaking Through “Automated” Cracks?
Don’t let 30% of your hard-earned revenue vanish into “Collections Purgatory.” Find out exactly where your billing process is failing.
We’ll analyze your current recovery rate and show you the “Human-Led” path to 3x higher collections.
📚 References
Trends in Healthcare Payments Annual Report (Instamed/J.P. Morgan)
Medical Group Management Association (MGMA) Stat: Rising Patient Responsibility Trends.
Kaiser Family Foundation (KFF): Analysis of Deductible Growth in Employer-Sponsored Insurance.
“In a world of cold automation, empathy is no longer a ‘soft skill’—it is your highest ROI clinical metric. A bot can send a bill, but only a human can close the gap between a patient’s confusion and a practice’s cash flow.”
Dr. Maria opened her women’s health clinic in March. By July, she had 200 patients on the books and $47,000 sitting in unpaid claims.
Nobody had told her that a single overlooked field in her patient intake form was silently triggering systematic denials — month after month.
This isn’t a rare story. It’s the most common one we hear.
If you’re a clinic founder, private practice owner, or healthcare entrepreneur, you didn’t go to medical school to chase denied claims. But here’s the reality: revenue collection is not an afterthought — it’s the difference between a practice that thrives and one that slowly bleeds out.
📊 The Numbers Are Hard to Ignore
Practices lose up to 30% of potential revenue from billing errors that start at patient intake
Only 42% of patient revenue is collected at the time of service when no structured process exists
72% of patients pay immediately when offered an SMS payment link
66% pay faster when online billing is available
That first number is the one that should stop you cold. If your practice sees 30 patients a day, you may be working one out of every three days completely for free.
🤖 Why Everyone Is Talking About AI — And Why That’s Your Opportunity
Right now, every RCM vendor is selling AI as the answer to everything. And while automation absolutely has a role, there’s a growing gap between what technology promises and what practices actually experience.
Here’s the truth:
AI catches errors. A human expert understands why your specific payer mix is creating a pattern of denials — and redesigns your process to stop it before it starts.
AI submits claims. A human advocate fights for your money when a payer wrongfully rejects, navigating appeals with the nuance no algorithm can replicate.
AI gives you dashboards. A human strategist tells you what the numbers actually mean for your growth stage — and what to do about them tomorrow morning.
The clinics that win don’t choose between people and technology. They use smart technology directed by human expertise. That’s the model that actually works.
🏗️ 5 Things Every New Practice Needs to Get Right From Day One
1. Clean patient and insurance data at intake Every denied claim starts with a data problem. Verify insurance eligibility before every appointment — not just at registration. One wrong field costs you weeks.
2. Honest financial conversations with patients upfront Patients avoid bills they don’t understand. With high-deductible health plans now the norm, talking about co-pays and out-of-pocket costs before the visit isn’t awkward — it’s essential. Practices that do it consistently collect more.
3. Technology your team actually understands and trusts Real-time eligibility checks, automated claim scrubbing, and digital payment portals are standard in 2025. But technology amplifies what your team does — it doesn’t replace their judgment. Make sure your people own the tools, not the other way around.
4. Proactive denial management — not reactive damage control High-performing practices don’t discover denial patterns in a quarterly report. They identify payer-specific trends early, build appeal protocols that work, and treat AR aging like a critical clinical metric. The difference between a 15-day and 45-day AR cycle is usually just a structured follow-up process.
5. KPIs that drive decisions — not just reports
KPI
Target
Days in Accounts Receivable
Under 30 days
Clean Claim Rate
Above 95%
Net Collection Rate
Above 96%
Denial Rate
Below 5%
If you don’t know where your practice stands on these four numbers right now, that’s the first thing to fix.
💡 The Shift That Changes Everything
Most new clinics set up their billing as an afterthought — a software subscription, a part-time biller, and a hope that things work out. The ones that grow predictably treat revenue collection as a core clinical function from Day One.
That means:
Dedicated workflows from patient intake to final payment
A team that understands both the clinical and financial sides of each encounter
Regular reviews of performance data with someone who can actually interpret it
A partner who knows your payers, your market, and your growth goals
This is exactly what we do at RCAceSolutions. We don’t hand you a platform and wish you luck. We embed with your practice, learn your payer mix, and build a collection system designed specifically for your clinic — with human expertise at every stage.
🎯 Is Your Practice Collecting Everything It’s Owed?
Most clinics are surprised by how much revenue they’re leaving on the table — not because of bad doctors or bad intentions, but because nobody set up the right system from the start.
We’re offering a Complimentary Revenue Assessment for clinics and healthcare practices.
Our team will review your current billing workflows, identify exactly where revenue is leaking, and show you a clear path to fix it. No cost. No obligation. Just clarity.
A 12-provider orthopedic group recently discovered they had been underpaid $340,000 annually — for four consecutive years — on a single CPT code. Their contract was “successfully renegotiated” in 2021. Nobody checked if the new rate was ever loaded.
That’s not a billing problem. That’s a strategy problem.
The Uncomfortable Truth About Your Contracts Right Now
If you haven’t renegotiated since 2023, there’s a high probability you’re being systematically underpaid — and you don’t know it yet.
Here’s why 2026 is the year that gap becomes critical:
Medicare Fee Schedule Compression is pushing conversion factors down, and commercial payers use Medicare as their pricing floor. Without active renegotiation, your blended reimbursement quietly erodes in real dollars every single year.
The Cost-Reimbursement Gap is Widening. Operating costs are rising 4–5% annually. Commercial reimbursement increases average under 2%. That 2–3% annual gap doesn’t stay small — it compounds into a genuine solvency threat within 3–5 years.
Payer Consolidation Has Shifted the Power Balance. The top commercial carriers now control the majority of enrollment in most states. Less competition means rates won’t grow passively. If you’re not pushing, they’re not moving.
The clinics thriving in 2026 treat payer contract negotiation as a revenue growth strategy — not an administrative task they revisit every few years.
The 5-Phase Framework That Moves Reimbursement Rates
🔎 Phase 1: Revenue Intelligence Audit — Know Your Leverage Before You Enter the Room
You cannot negotiate what you haven’t measured. Before any conversation with a payer, build your data dossier:
Top 30 CPT codes by volume, benchmarked against Medicare rates AND Fair Health 80th percentile commercial rates
Denial trends segmented by payer
Network adequacy gaps — are you the only specialist within 15 miles? That’s structural leverage most practices never use
Your patient outcomes data vs. regional benchmarks
Here’s what consistently surprises clinic owners: most practices discover 3–7 high-volume codes reimbursed 15–25% below market — often representing $100,000–$400,000 in annual underpayment that’s been silently accumulating for years.
Requesting a blanket 5% increase across all codes is the fastest way to get a blanket 2% counteroffer. Payers are prepared for that conversation. You want a different conversation entirely.
Segment your codes into three buckets:
Category
Strategy
🔴 High-volume, significantly underpaid
Anchor 20–30% increase — lead here
🟡 Moderate volume, modestly below market
marketRequest 10–15% — secondary push
🟢 Near-market rates
Protect and preserve — minimal concessions
Specificity signals that you’ve done the work. Payers respond differently to a practice that walks in saying “your 99214 reimbursement sits at 108% of Medicare while the regional commercial average is 128%” than to one asking for “something more reasonable.” Data shifts the power dynamic before the negotiation even begins.
🤝 Phase 3: The Human Approach — Where Most Practices Leave Money Behind
Data gets you to the table. How you handle the room determines what you leave with.
Lead with partnership, not confrontation. Payers — especially regional plans — have genuine pressure around network stability and quality metrics. Position your practice as a solution to their cost and access problems, not a vendor demanding more money. That framing alone changes the tenor of the negotiation.
Anchor high and justify fully. Negotiation research is unambiguous: the first number stated has outsized influence on the final outcome. Present your highest defensible ask, backed by your data dossier, and let them respond to your number — not the other way around.
Know the five counter-tactics before they use them:
“Our medical cost trends don’t support an increase”→ Redirect to your specific outcomes data. Show them how your care model reduces their total cost per member.
“We’ve finalized our network rates for this cycle”→ Ask to schedule planning conversations for the next cycle. Signal — clearly — your willingness to escalate if current terms can’t be addressed.
“Your competitors accepted X rate” → Don’t take that bait. Redirect to your unique access and quality value. You’re not negotiating your competitors’ contracts.
“We can offer a quality bonus instead”→ Bonuses are additions, never substitutions. If it’s not in the base rate, it’s not guaranteed revenue.
“This is our best and final offer” → It almost never is. Request a 10-day hold, refine your data on 2–3 specific codes, and return with sharper anchors.
And if you’ve ever submitted a corrected claim and wondered why the rate still looked wrong — you were probably right. Billing directors and office managers: this one is for you. Your instincts about systematic underpayment are frequently correct. This framework gives you the language and data to prove it.
Your BATNA (Best Alternative To a Negotiated Agreement) is your backbone. Know the reimbursement floor below which you genuinely cannot sustain quality care — and be prepared to say it. Payers respond very differently to providers who demonstrate a real willingness to terminate network participation than to those who accept whatever is offered.
📑 Phase 4: Contract Forensics — Don’t Let Fine Print Erase Your Win
An 18% rate increase means nothing if contract language quietly claws it back. Before you sign, review for:
Silent PPO and downstream assignment clauses that allow payers to pass your rates to networks you’ve never agreed to serve — silently diluting your negotiated improvement by 8–15%.
Unilateral amendment provisions that let payers update fee schedules or clinical policies mid-cycle with as little as 30 days notice, effectively nullifying what you just negotiated.
Auto-renewal traps that lock you into current rates for another 12–24 months if you miss the written notice window.
Clean claim submission windows and prompt-pay timelines — shorter windows increase denial exposure; missing payment timeline provisions means payers earn float on your delayed payments.
Revenue gains are won at the table and lost in the fine print.
📊 Phase 5: 90-Day Post-Signature Monitoring — Where 63% of Practices Fail
According to Crowe Healthcare Advisory, 63% of providers never verify whether newly negotiated rates were correctly loaded into payer systems — resulting in an average of 4–7 months of underpayment at old rates before anyone catches it.
That orthopedic group from the beginning of this article? That’s exactly what happened to them.
After every signed contract:
Get written confirmation of effective date and updated fee schedule within 48 hours
Audit your top 10 CPT codes within the first 30 days
Cross-reference payments against contracted rates for 3 full billing cycles
Document discrepancies immediately and submit disputes within the contractual window
Negotiating a better rate is the first half. Verifying you’re actually receiving it is the second.
If you’re below these benchmarks, contract optimization and operational tightening need to happen simultaneously — one without the other leaves significant revenue unrealized.
The 3-Year Revenue Reality Check
For a clinic billing $2.4M annually:
Scenario
3-Year Total Revenue
Status quo (rate erosion of ~1.5%/year)
~$7.09M
18% improvement + ongoing protection
~$8.58M
The Difference
~$1.4M
That’s a provider hire. A facility upgrade. Or the margin stability that transforms a stressed practice into one that can actually plan for the future.
And that difference starts with a single contract cycle done right.
Why Partner With RCAceSolutions
Most billing companies handle your claims. RCAceSolutions engineers your revenue.
That’s not a tagline — it’s a structural difference in how we work.
We serve as a Revenue Growth Partner across the full contract lifecycle:
✔ Revenue Intelligence Audits — We analyze months of your claims data to identify exactly where revenue is leaking and quantify the opportunity.
✔ CPT-Level Benchmarking & Negotiation Strategy — We build your payer-specific data dossier and negotiation playbook, including code-level gap analysis against current market rates.
✔ Contract Language Forensics — Before you sign anything, we review for every clause that could undermine your rate improvement.
✔ Post-Signature Verification & Ongoing Optimization — We monitor payment accuracy after execution and prepare you for the next renegotiation cycle 12–18 months before your contract anniversary — so you’re never negotiating from a reactive, last-minute position again.
We work with independent practices, specialty clinics, ambulatory surgery centers, multi-site groups, and safety-net providers. Every engagement is built around one question: How much revenue have you earned that you haven’t collected yet?
Ready to Find Out What You’ve Been Leaving Behind?
Most clinics don’t know which CPT codes are underpaid, how far below market their contracts actually sit, or how much revenue is silently eroding each year.
If there’s even a 30% chance you’re leaving $200,000+ on the table annually, a 30-minute conversation pays for itself before it’s over.
In 30 minutes, we’ll identify your highest-opportunity codes, compare your rates to current market benchmarks, and give you a clear picture of your revenue improvement potential. No obligation — just data.
Your Revenue. Your Practice. Our Mission.
Sources:
MGMA 2025 Cost & Revenue Survey
HFMA 2025 Revenue Cycle Benchmarking
Change Healthcare 2024 Denial Benchmark
CMS 2026 Medicare Physician Fee Schedule
BLS Medical Care CPI 2022–2025
AIS Health Commercial Enrollment Data 2025
Crowe Healthcare Advisory 2024
Fair Health Consumer Database 2025
“Payers come to the table with actuaries, algorithms, and years of your own claims data used against you. The least you can do is bring a spreadsheet — and someone who knows how to use it.”
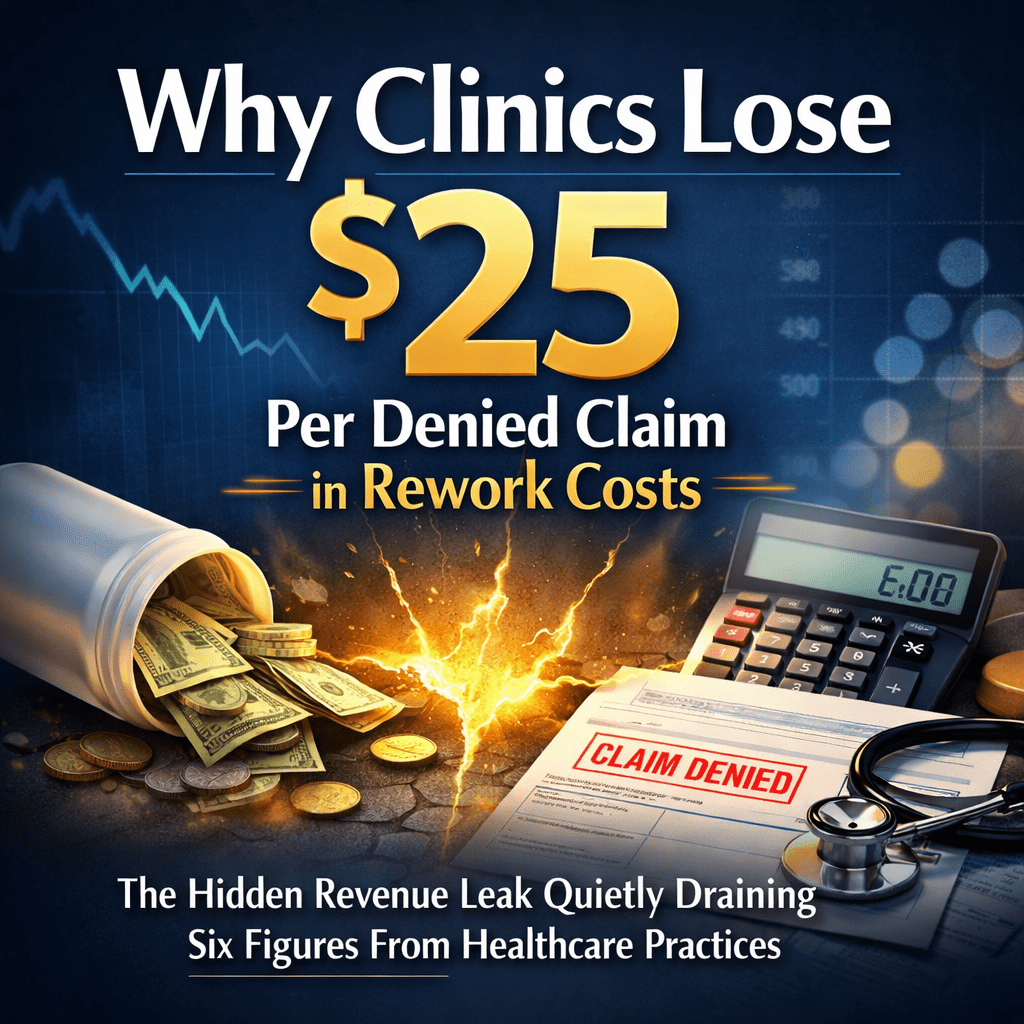
The Hidden Revenue Leak Quietly Draining Six Figures From Healthcare Practices 💸
Most clinics track revenue. Few track revenue leakage.
Every denied claim doesn’t just delay payment—it triggers an average $25–$117 in administrative rework costs, according to industry research. Multiply that by a 10–15% denial rate, and what looks like a “stable” practice is quietly losing tens—or hundreds—of thousands annually.
If you’re a Clinic Owner, Practice Manager, or Healthcare CFO, this is not a billing issue. It’s a margin erosion problem.
The Real Cost of a Denied Claim 📊
Industry benchmarks show:
Average denial rate: 10–15%
Rework time per claim: 15–30 minutes
Never-recovered claims: 5–8%
Cash flow delay: +30–40% longer A/R cycles
For a clinic processing 1,000 claims monthly:
100–150 denials
$2,500–$3,750 monthly rework cost
$30,000–$45,000 annual administrative waste
Plus unrecovered revenue loss
That’s before factoring in staff burnout, compliance exposure, and patient dissatisfaction.
Why Denials Happen (And Why Most Are Preventable) ⚠️
Top denial drivers across medical practices:
30% – Missing/invalid patient information
25% – Prior authorization failures
20% – Coding errors (CPT/ICD-10 mismatches)
15% – Timely filing issues
10% – Documentation gaps
These are front-end failures, not payer conspiracies.
High-performing clinics treat denial prevention as a system—not a reaction.
The Denial Death Spiral 🔁
Unchecked denial rates create:
1️⃣ Cash Flow Compression
Payments stretch from 30 to 60–90 days, increasing working capital strain.
2️⃣ Staff Burnout
Billing teams spend hours on appeals instead of optimization.
3️⃣ Patient Frustration
Billing confusion drives negative reviews and lost referrals.
4️⃣ Compliance Risk
Repeated corrections increase audit exposure.
Denials are not a billing problem. They’re a leadership visibility problem.
What High-Performance Clinics Do Differently 🚀
Revenue-optimized practices focus on:
✔ Intelligent Front-End Verification
Real-time eligibility checks and authorization tracking before services are rendered.
✔ Documentation Intelligence
Coding accuracy aligned with payer-specific medical necessity rules.
Most Clinics Don’t Know Where They’re Losing Money — Until It’s Too Late. Join the FREE RCAceSolutions Newsletter and learn how to reduce denials, accelerate collections, and improve cash flow before revenue slips away.
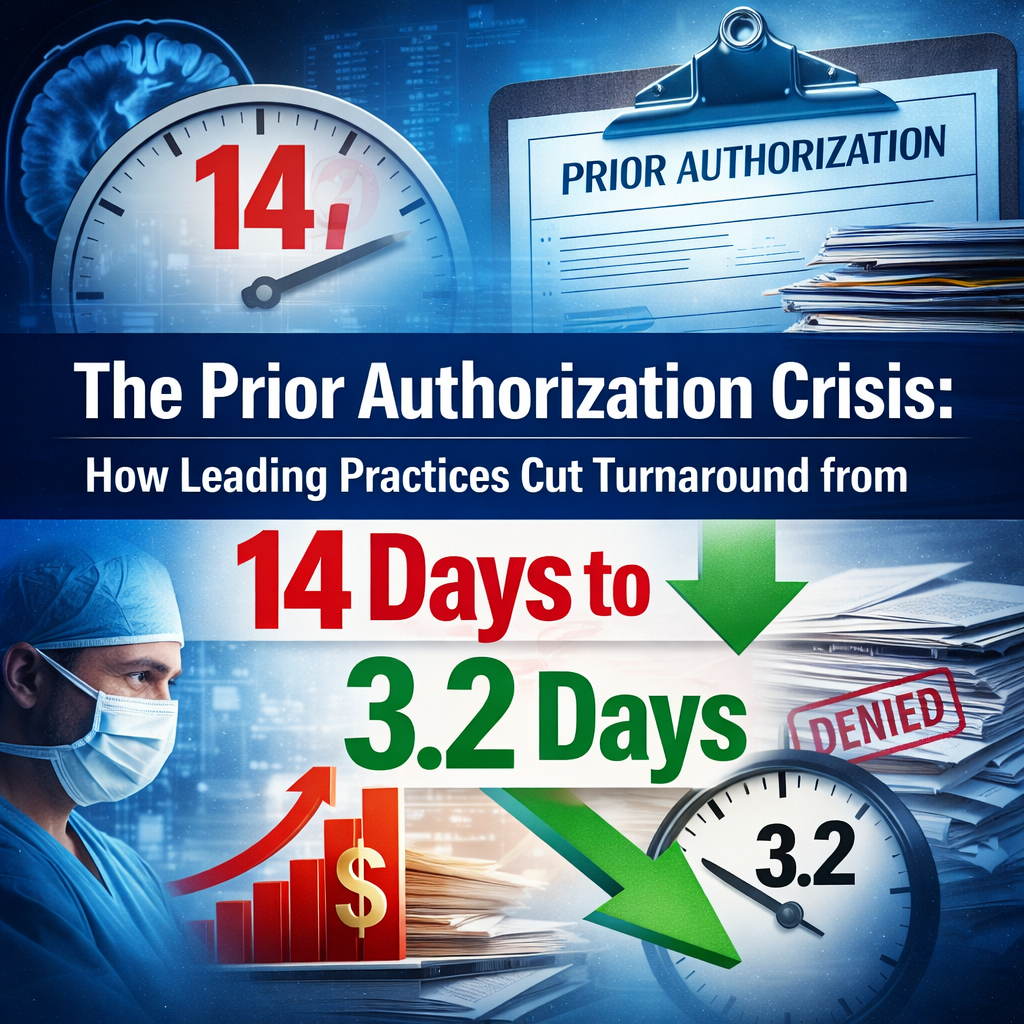
The most expensive room in your clinic isn’t your OR. It’s your authorization queue.
A 45-minute MRI shouldn’t take 14 days to get approved. Yet across the U.S., prior authorization delays are freezing revenue, exhausting staff, and putting patient outcomes at risk.
This isn’t just administrative friction. It’s a revenue velocity problem.
The Real Cost of Prior Authorization Delays 💸
According to the American Medical Association:
93% of physicians report prior authorization delays necessary care
82% report patients abandon treatment due to delays
Practices spend 13+ hours weekly on authorizations
Data from the Medical Group Management Association shows authorization delays increase cancellation risk by 41%.
Meanwhile, research published in Health Affairs estimates $31 billion annually in administrative waste across the U.S. healthcare system.
For the average physician, that translates to ~$79,000 per year in lost productivity.
Why High-Revenue Procedures Suffer Most 📊
MRIs, CT scans, specialty surgeries, biologics, and advanced imaging face the longest delays.
When a $3,500 procedure sits in limbo for 14 days:
Cash flow stagnates
Overhead continues
Staff spend 2–4 hours chasing status updates
Denial rates average 19% nationally
Each denial can trigger 30–45 additional days of delay.
The result? Revenue unpredictability and patient dissatisfaction.
The 3.2™ Revenue Velocity System 🚀
Top-performing practices don’t “manage” prior authorizations. They operationalize them as a revenue acceleration strategy.
Here’s how elite Revenue Cycle teams reduce turnaround to 3.2 days:
1️⃣ Same-Day Authorization Submission
Documentation finalized during visit
Requests submitted within 2 hours
Real-time payer portal monitoring
Result: 64% faster processing.
2️⃣ Payer-Specific Intelligence 🧠
Dedicated knowledge bases include:
CPT-specific documentation requirements
Preferred submission channels
Historical denial triggers
Denials drop from 19% to under 7%.
3️⃣ Dedicated Authorization Teams 👥
According to the Healthcare Financial Management Association, practices with specialized teams process requests 5.3x faster than general admin staff.
This protects clinical time and reduces burnout.
4️⃣ 24-Hour Follow-Up Protocol ⏱
Escalation within 48 hours
Peer-to-peer reviews triggered early
Daily tracking dashboards
“Squeaky wheel” systems reduce delays dramatically.
5️⃣ Technology Integration 💻
Per KLAS Research: Integrated authorization platforms reduce processing time by 58% and lower administrative costs significantly.
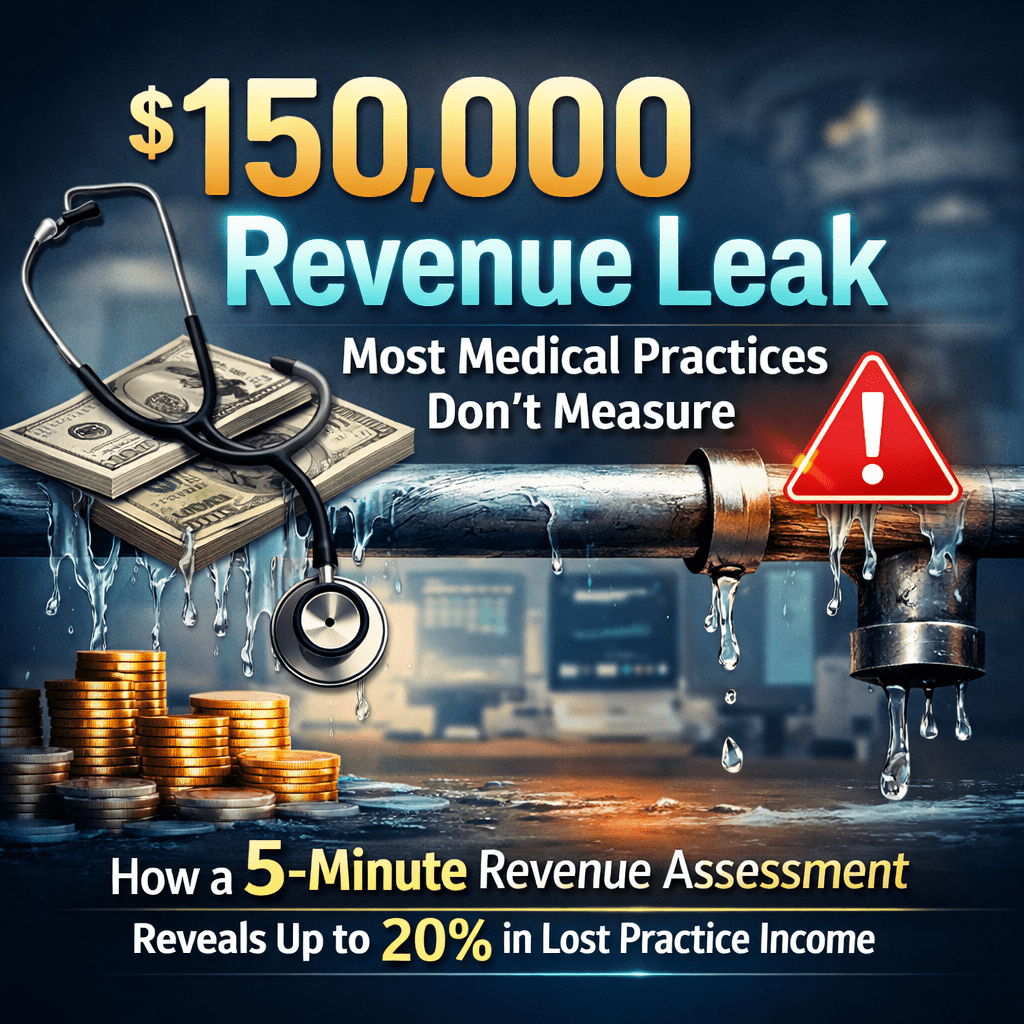
How a 5-Minute Revenue Assessment Reveals Up to 20% in Lost Practice Income
Medical practices lose $50K–$200K annually due to hidden revenue leaks. Discover the 5 key RCM metrics and use a FREE Revenue Leak Assessment to uncover recoverable income in minutes.
You’re seeing more patients. Your team is working harder than ever. Yet your revenue doesn’t reflect the effort.
This isn’t a productivity problem. 👉 It’s a revenue visibility problem.
According to industry benchmarks, most medical practices lose 10–20% of collectible revenue every year—not because of fraud or poor care, but because critical revenue metrics are not measured, monitored, or acted on consistently.
For a practice earning $1M annually, that’s $100,000–$200,000 quietly leaking out every year.
The Silent Revenue Crisis in Healthcare ⚠️
Healthcare leaders often assume declining margins are caused by:
Lower reimbursement rates
Higher staffing costs
Increased patient responsibility
While those are real pressures, the bigger issue is undiagnosed revenue leakage inside the revenue cycle.
Practices don’t fail financially because they lack patients. They struggle because they don’t measure where revenue is lost.
The 5-Leak Revenue Framework™ 🔍
After reviewing practices, the same five revenue leak points appear repeatedly—across all specialties.
1️⃣ Net Collection Rate (The Master Metric)
Healthy benchmark: 95%+
Average reality: 85–92%
Impact: Every 1% below benchmark = ~1% of annual revenue lost
💡 A $1M practice at 90% NCR is leaving $50,000 uncollected.
“We built the FREE RCA Revenue Leakage Diagnostic™ to estimate potential leakage. Comment ‘Audit’ and I’ll send it.”
Talk to a Healthcare Revenue Expert—Free Assessment IncludeD 🎧
Stop guessing where your money is going. Our experts will help to uncover 10–20% in recoverable revenue using industry benchmarks and proven RCM diagnostics.
📊 Designed for Clinics, Medical Practices, and Healthcare Providers ⏱ Takes just 20 to 30 minutes 🎯 Actionable insights guaranteed
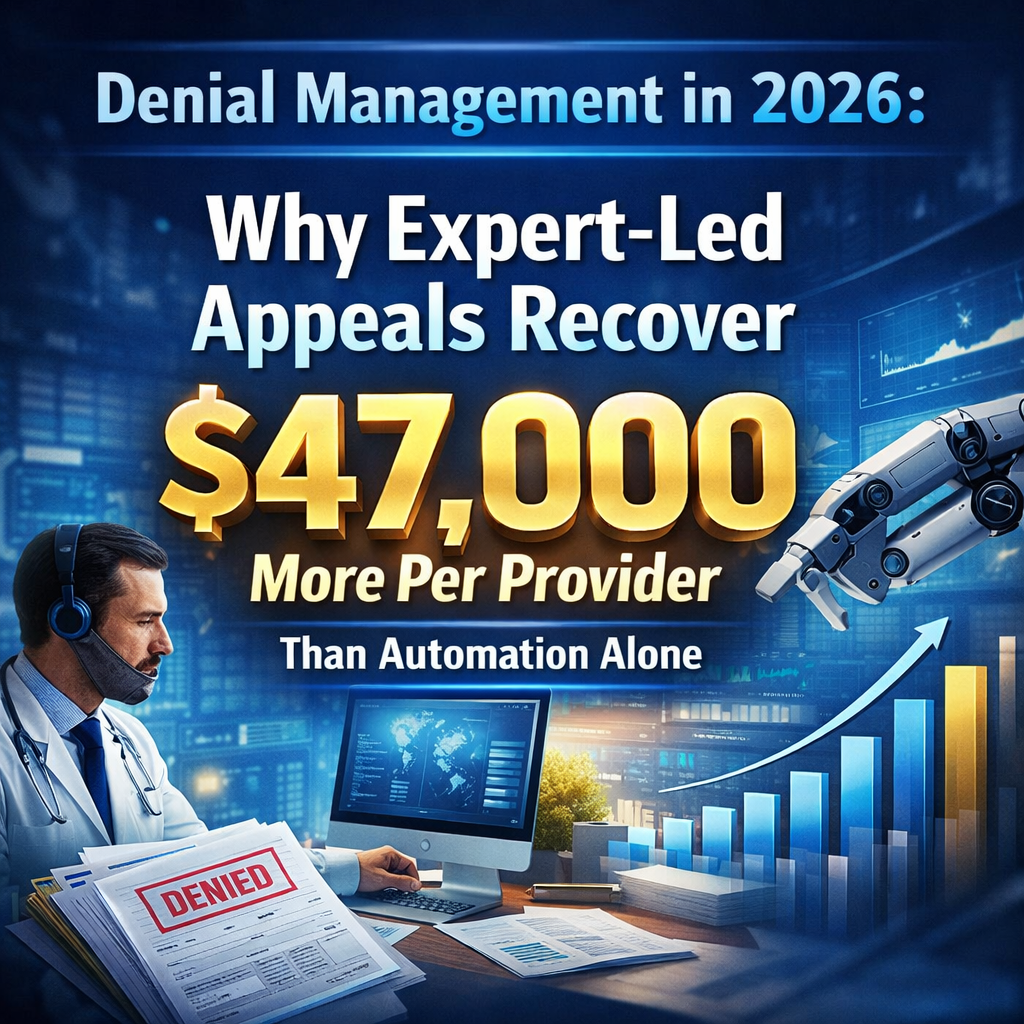
The $262 Billion Revenue Leak Healthcare Can’t Ignore
Every 60 seconds, healthcare practices lose $8,500 to claim denials. In 2026, denial management is no longer an operational nuisance—it’s a profit-or-loss decision.
According to industry benchmarks, the average provider leaves $47,000 per year uncollected when relying on automation-only denial systems. Multiply that across your practice, and the financial damage becomes impossible to ignore.
This isn’t about working harder. It’s about working smarter—with the right expertise.
The Automation Illusion: Why AI Alone Falls Short 🤖⚠️
Automation has improved speed—but not judgment.
A 2025 MGMA analysis of 847 healthcare practices revealed a clear performance gap:
Automated-Only Denial Systems
Average recovery per provider: $83,000
Complex appeal success rate: 34%
Average resolution time: 67 days
Expert-Led Appeal Processes
Average recovery per provider: $130,000
Complex appeal success rate: 76%
Average resolution time: 43 days
👉 That’s a $47,000 annual difference per provider.
Why? Because denial management is not just a data problem—it’s a clinical, regulatory, and payer-specific narrative problem.
Why Human Expertise Wins in 2026 🧠📋
1. Medical Necessity Requires Clinical Storytelling
AI submits templates. Experts build payer-specific clinical narratives grounded in guidelines, documentation, and medical judgment.
📊 AMA data shows appeals with detailed clinical rationale are 91% more likely to be overturned.
2. Payer Intelligence Beats Generic Algorithms
Each payer has unique rules, triggers, and review behaviors.
Expert teams understand:
Payer-specific documentation standards
When peer-to-peer reviews actually work
Historical approval patterns by region and specialty
📈 Practices using payer-specific strategies recover 58% more denied revenue.
3. Pattern Recognition Prevents Future Denials
Automation sees claims. Experts see systems.
They identify:
Silent payer policy changes
CPT or modifier misuse
Provider-specific denial trends
This enables prevention, not just recovery.
The 2026 Sweet Spot: Hybrid Denial Management 🚀
Top-performing practices don’t choose between tech and talent—they combine both.
“Automation accelerates processes, but expertise secures payment. In 2026, expert-led denial management is the difference between revenue written off and revenue recovered.”
Why 34% of “Fully Automated” Claims Still Need Human Review—and What That’s Costing Your Practice 💸
AI-powered medical billing promised faster claims, fewer denials, and lower costs. For many clinics, the reality looks very different.
Behind the dashboards and automation claims, over one-third of AI-processed medical claims still require human intervention—creating delays, denials, and silent revenue loss.
This is not a technology failure. It’s a strategy failure.
The Promise vs. Reality of AI-Only Medical Billing 🤖⚠️
Most AI billing platforms excel at speed and repetition. They fail where healthcare reimbursement matters most: clinical judgment, payer nuance, and denial defense.
Industry data shows:
10–25% average claim denial rates across payers
34% of AI-processed claims flagged for manual review
46% of medical documentation fails audit-level support
When automation replaces expertise instead of supporting it, revenue leakage is inevitable.
The 4 Hidden Failure Points of AI-Only Billing
1. Clinical Context Blind Spots 🩺
AI recognizes patterns—but it cannot interpret nuanced clinical scenarios.
Modifier usage, medical necessity, and complexity-based coding still require human judgment. Even a 10% coding error rate translates into six-figure losses annually for mid-size practices.
2. Payer Rules Change Faster Than AI Can Learn 📄
With 900+ payers and hundreds of policy updates per year, AI systems struggle to keep pace with:
Prior authorization rules
Coverage limitations
Documentation requirements
Result: avoidable denials and delayed payments.
3. Documentation Quality Gaps 📝
AI can confirm required fields—but it cannot evaluate whether documentation will withstand a human audit.
This leads to:
Post-payment recoupments
Audit exposure
Revenue clawbacks months later
4. Denial Management Is Still a Human Game 📞
Successful appeals depend on:
Clinical reasoning
Payer-specific language
Human-to-human negotiation
Appeal success rates are 63% with Expert Billing teams versus 39% with Automation alone.
The Real Cost of “Fully Automated” Billing 📉
For a practice submitting 10,000 claims annually:
3,400 claims flagged for review
1,200 first-pass denials
$118 average rework cost per denial
$250,000–$400,000 in hidden annual losses
Automation didn’t eliminate cost—it shifted it downstream.
Why Hybrid Billing Models Outperform AI-Only Systems 🚀
Top-performing practices don’t choose AI vs. Humans. They choose AI + Expert oversight.
Hybrid revenue cycle models deliver:
23% higher first-pass acceptance rates
41% faster payment cycles
19% higher net collections
67% lower rework costs
AI handles Volume. Humans protect Revenue.
Where RCAceSolutions Is Different 🤝
RCAceSolutionsis not a software vendor—we are a Revenue Growth Partner.
We combine:
Expert-led, technology-driven solutions
Medical billing and Revenue Cycle Management (RCM) Experts
Strategic Denial Prevention and Management
Continuous Revenue Optimization
The Question Every Healthcare Leader Should Ask ❓
If 34% of Automated Claims still need Human Review— who is protecting your Revenue when automation fails?
Discover what your practice is really leaving on the table.
Our Free Revenue Assessment includes: ✅ Where you’re losing revenue right now ✅ Which denial patterns are costing you the most ✅ How to stabilize cash flow in the next 30 days ✅ What your revenue could look like with expert support
Her pediatric clinic occupied a prime location in a growing suburb. Patient reviews? Five stars across the board. Her schedule was booked solid three weeks out. By every visible measure, she was winning.
Six months later, she locked the doors for good.
The problem wasn’t her medical expertise or patient care—it was a silent cash flow crisis she never saw coming. Despite a packed waiting room, her bank account told a different story: delayed payments, mounting denials, and revenue that somehow never materialized.
Dr. Chen isn’t an outlier. She’s the norm.
💔 The Brutal Statistics New Clinic Owners Face
Here’s what the healthcare industry doesn’t advertise:
70% of healthcare startups fail within their first 5 years. The culprit isn’t lack of patients or poor clinical outcomes—it’s financial mismanagement, specifically around Revenue Cycle Operations.
And the damage happens fast. The first 90 days determine whether your clinic builds sustainable momentum or bleeds revenue through preventable billing errors, insurance denials, and operational blind spots.
The Hidden Revenue Crisis
Even practices with strong patient volume hemorrhage money:
📉 10–25% of potential revenue is lost due to billing inaccuracies and ineffective follow-up
🔄 The average medical claim gets denied 15–20% of the time on first submission
💸 67% of denied claims are never resubmitted, becoming permanent revenue loss
⏱️ It takes 30–90 days to collect payment—if you get it at all
When clinic owners expect revenue to grow naturally with patient volume, they’re shocked when cash flow stalls. The math doesn’t lie: high patient count ≠ healthy revenue without proper revenue cycle management.
🎯 Why Technology Alone Won’t Save You
Many clinic owners make a critical assumption: invest in billing software, and RCM problems solve themselves.
This is dangerously wrong.
Automation is powerful—but without expert oversight, it doesn’t fail quietly. It fails at scale. One bad template can deny 1,000 claims before you notice. One misconfigured rule can underbill every visit for months.
The Human-Led RCM Advantage
Here’s what separates surviving clinics from thriving ones: they don’t work harder—they work with experts who’ve seen every denial pattern, payer quirk, and billing trap.
A human-led RCM model combines best-in-class technology with seasoned professionals who understand:
✅ Payer-Specific Rules – Each insurance company has unique requirements. Experts navigate these nuances to prevent denials before submission.
✅ Proactive Denial Prevention – Rather than reacting after claims bounce, skilled teams catch issues upstream—missing documentation, eligibility gaps, coding errors.
✅ Strategic Revenue Optimization – Professional coders and billing specialists don’t just process claims—they identify underbilling patterns, optimize charge capture, and maximize reimbursement within compliance guidelines.
🔑 The 90-Day Survival Framework
The first three months set your financial trajectory for years. Here’s what high-performing clinics do differently:
Month 1: Foundation
Implement robust insurance verification at patient intake
Establish accurate charge capture workflows
Set up real-time denial tracking and alerts
Assign dedicated RCM accountability (internal or partner)
Month 2: Optimization
Review first month’s denial patterns and fix root causes
Audit coding accuracy and documentation completeness
Implement patient payment policies and communication
Begin benchmarking key metrics (collection rate, days in A/R, denial rate)
Month 3: Acceleration
Refine workflows based on performance data
Address aging accounts receivable aggressively
Scale what’s working, eliminate what’s not
Project revenue trends and adjust operations accordingly
The clinics that survive don’t guess—they measure, adjust, and optimize relentlessly.
🚀 How RCAceSolutions Prevents the 67%
At RCAceSolutions, we’ve built our entire model around one mission: preventing the preventable failures that destroy new clinics.
We’re not a software vendor. We’re not a billing service that processes claims robotically. We’re your Revenue Growth Partner—combining deep healthcare expertise with proven workflows that stabilize cash flow fast.
What Makes Us Different
🎯 Dedicated RCM Specialists – Seasoned professionals in healthcare finance.
📊 End-to-End Revenue Optimization – From Patient Registration through Final Payment posting, we manage every touchpoint
💡 Real-Time Performance Insights – You get transparent reports showing exactly where revenue is won or lost
⚙️ Custom Workflows That Scale – We align our processes with your specialty, payer mix, and growth objectives
Partnership, Not Transaction
We don’t just process your billing—we act as your fractional CFO for revenue operations:
🤝 Strategic consultation aligning financial ops with business goals
📈 Workflows designed to scale as patient volume grows
💰 Optimized cash flow for reinvestment in care delivery and expansion
🎓 Ongoing training and coaching for your clinical team
Don’t just survive the first 90 days—thrive through year one and beyond.
📊 The Proof Is in the Numbers
Independent research confirms what we see daily:
Practices with expert RCM support collect 20–30% more revenue than those managing billing in-house
Denial rates drop from 15–20% to under 5% with proactive management
Administrative costs decrease by 30–40% through workflow optimization
Patient satisfaction increases when billing is transparent and professional
The math is simple: Invest $1 in expert RCM, gain $3–5 in recovered revenue and prevented losses.
✅ Your Next Step: Don’t Become a Statistic
The first 90 days are ticking. Every day without optimized RCM is revenue you’ll never recover.
You have two paths:
Path 1: Navigate RCM alone, learn through expensive mistakes, and hope you survive long enough to figure it out.
Path 2: Partner with experts who’ve guided clinics through this exact challenge—and prevented 67% of the failures that destroy well-meaning practices.
🎁 Get Your FreE RCM Survival Audit
We’ll analyze your current Revenue Cycle and show you exactly:
✓ Where you’re losing revenue right now
✓ Which denial patterns are costing you the most
✓ How to stabilize cash flow in the next 30 days
✓ What your revenue could look like with expert support
No obligation. No sales pressure. Just actionable insights you can use immediately.
Stop Chasing Claims and Start Optimizing Your Revenue.
Get one actionable RCM strategy, billing update, or compliance tip delivered to your inbox every week. Join the RCAceSolutions community for FREE and master your billing cycle.
💼 About RCAceSolutions
RCAceSolutions specializes in human-led Revenue Cycle Management for independent medical practices, specialty clinics, and healthcare startups. Our team of Medical Billing specialists and Revenue Cycle experts has optimized financial operations across diverse specialties to ensure peak profitability
Our Mission: Ensure that excellent clinical care translates to excellent financial health—so you can focus on patients, not paperwork.
📚 References
Medical Group Management Association (MGMA) – Practice Performance Benchmarks 2024
Healthcare Financial Management Association (HFMA) – Revenue Cycle Best Practices Study
American Academy of Professional Coders (AAPC) – Denial Management Analysis 2024
Advisory Board – Healthcare Startup Survival Rates Research