CMS 2026 Prior Authorization Rule: How the 72-Hour Mandate Will Reshape Healthcare Revenue Cycles โฑ๏ธ

By RCAceSolutions | Revenue Growth Partner

The countdown has begun.
Starting January 1, 2026, healthcare providers will operate under one of the most consequential regulatory shifts in prior authorization history. The CMS Interoperability and Prior Authorization Final Rule (CMS-0057-F) introduces strict response timelines that will fundamentally alter revenue cycle operationsโ€”and expose any remaining inefficiencies at scale.

For providers who are unprepared, this is not simply a compliance challenge. It is a direct threat to cash flow stability, staff capacity, and patient access to care.

The Revenue Storm Healthcare Leaders Can No Longer Ignore โš ๏ธ

Beginning January 1, 2026, CMS mandates that payers respond to prior authorization requests within defined timeframes:

  • Urgent requests: 72 hours
  • Standard (non-urgent) requests: 7 calendar days

These requirements apply to Medicare Advantage, Medicaid managed care, CHIP managed care, and ACA marketplace plans.

Executive takeaway:
Authorization delays now translate directly into measurable financial risk and public accountability.

Public reporting of authorization metrics will begin March 31, 2026, increasing transparency across payerโ€“provider relationships and raising the stakes for operational performance.

The Current State of Prior Authorization: An Unsustainable Baseline ๐Ÿ“‰

Despite years of incremental reform, prior authorization remains one of healthcareโ€™s most resource-intensive administrative burdens.

Current industry data shows:

  • Physicians process an average of 43 prior authorizations per week
  • 14 hours per physician per week are consumed by authorization-related tasks
  • 94% of patients experience delays in care due to authorization requirements
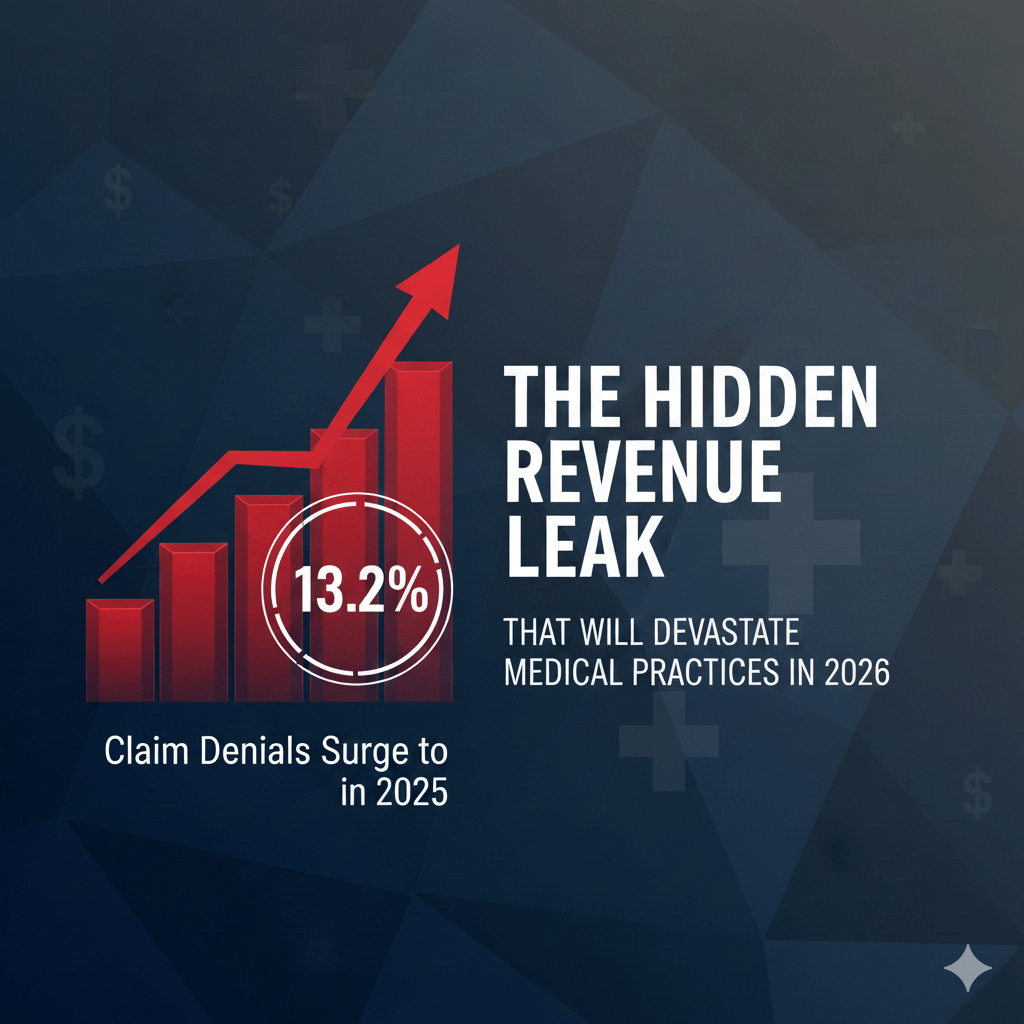
  • 27% of authorization requests are often or always denied
  • Over $35 billion annually is spent on administrative costs related to prior authorization

More concerning, nearly 90% of physicians report that prior authorization increases overall healthcare utilization, driving downstream costs rather than reducing them.

Translation for revenue leaders:
The existing system already strains marginsโ€”and the 2026 timelines remove any remaining tolerance for inefficiency.

Why the 2026 CMS Mandate Changes Everything for Revenue Performance ๐Ÿ’ฐ

The New Non-Negotiables

Urgent Authorizations

  • 72-hour mandatory response window
  • Immediate clinical and administrative triage required
  • Near-real-time tracking and escalation capabilities

Standard Authorizations

  • 7-calendar-day response limit
  • Clear, documented denial rationales required
  • Increased audit and reporting exposure

Critical insight:
While CMS extended API technical compliance deadlines to 2027, operational enforcement begins in 2026. Waiting for full system modernization before changing workflows will result in preventable revenue disruption.

The Hidden Revenue Risks Most Clinics Overlook ๐Ÿ”

CMS projects administrative savings of $15 billion over ten yearsโ€”but only for organizations that adapt quickly. Providers maintaining legacy workflows face compounding risks:

  1. Escalating Denial Rates
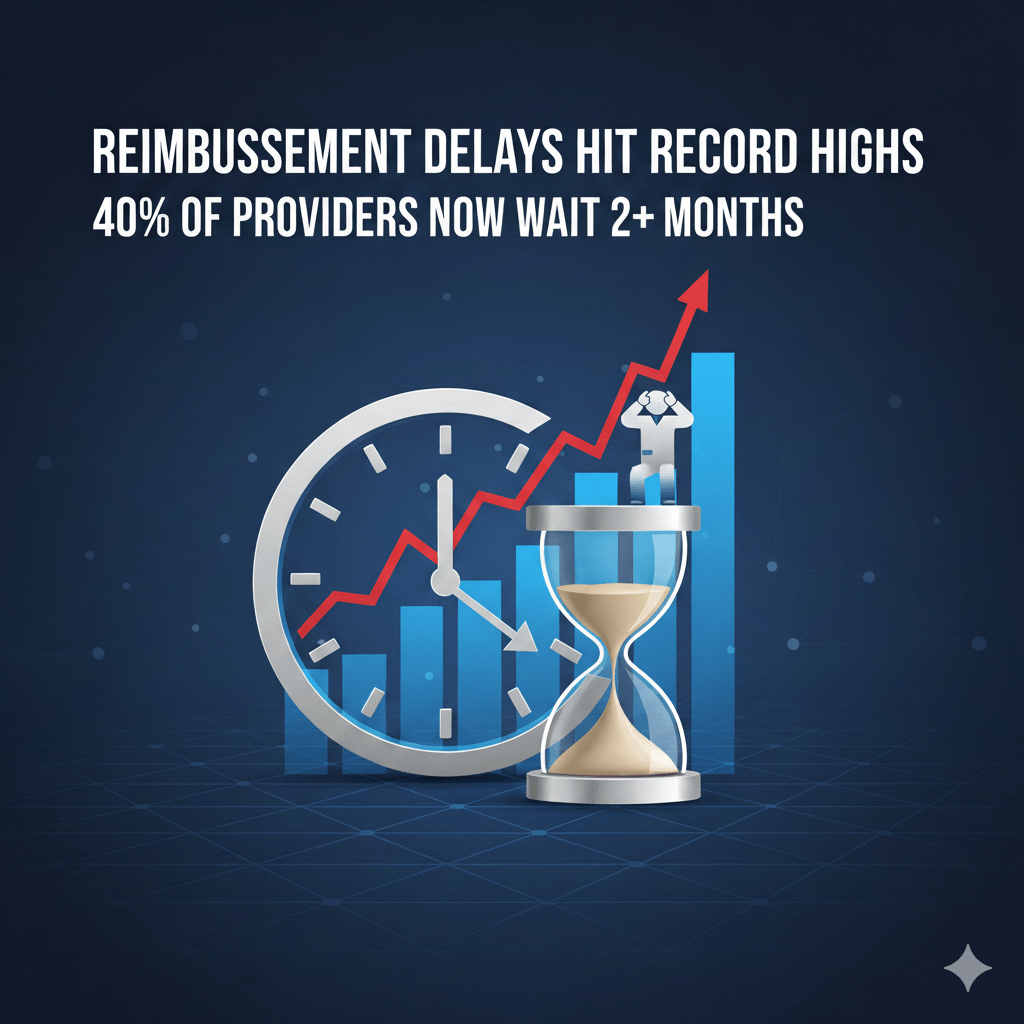
    Incomplete documentation under compressed timelines increases first-pass denials.
  2. Cash Flow Volatility
    Delayed authorizations delay procedures, billing, and collections.
  3. Staff Burnout and Cost Inflation
    Manual processes require more staff hours precisely when speed is critical.
  4. Operational Disadvantage with Payers
    Providers that consistently miss timelines will face increased scrutiny and strained payer relationships.

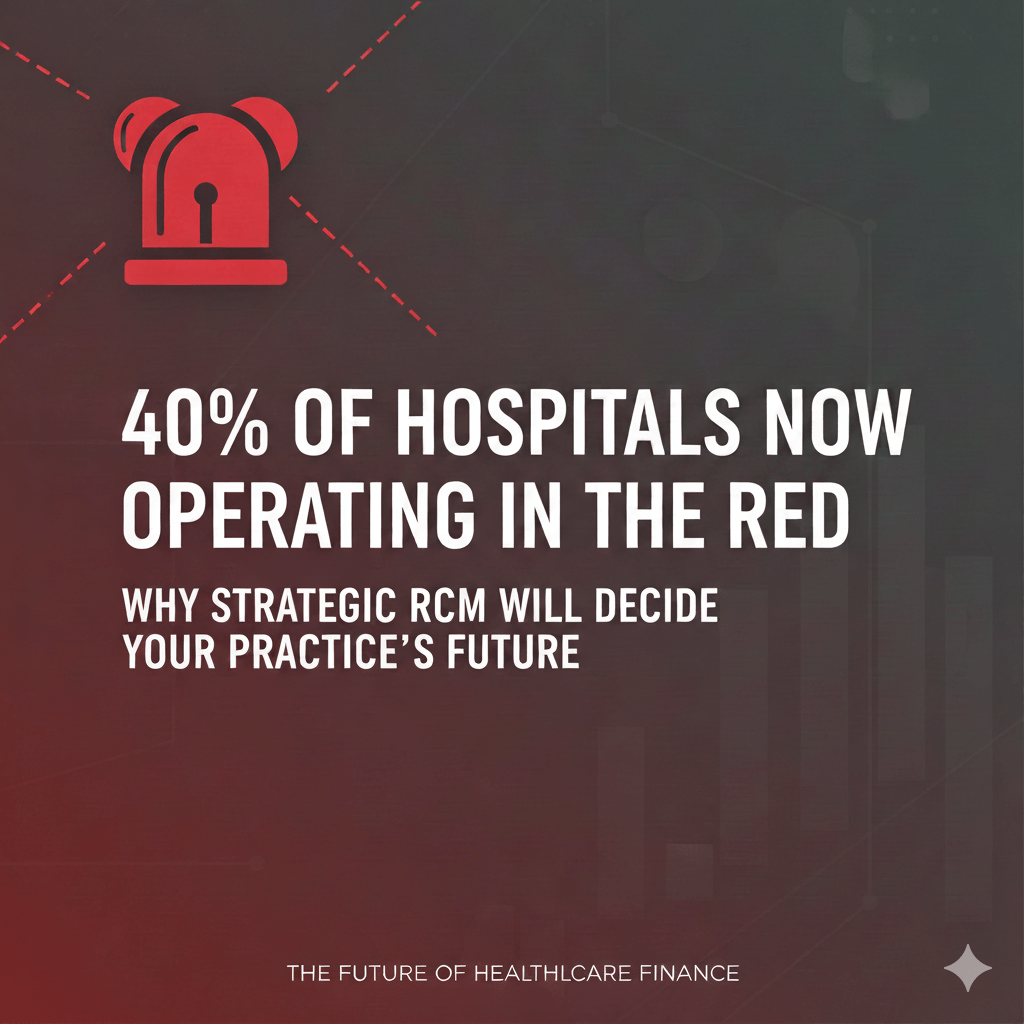
Prior Authorization as a Strategic Revenue Lever ๐Ÿš€

Forward-thinking healthcare organizations are reframing prior authorization from a compliance burden into a revenue cycle optimization function.

Five Pillars of 2026 Authorization Readiness

1. Intelligent Intake Automation ๐Ÿค–

Modern RCM platforms:

  • Pre-validate eligibility in real time
  • Auto-populate payer-specific documentation
  • Distinguish urgent vs. standard requests automatically
  • Reduce submission errors by up to 60%

2. Proactive Documentation Architecture ๐Ÿงฉ

High-performing clinics implement:

  • Standardized clinical templates aligned with payer policies
  • Point-of-care decision support
  • Automated attachment of diagnostics and clinical notes

3. Real-Time Authorization Tracking ๐Ÿ“Š

Essential visibility includes:

  • Time-to-submission metrics
  • Payer response time monitoring
  • Denial trend analysis
  • Revenue impact dashboards

4. Strategic Denial Management ๐Ÿ”

Effective denial recovery requires:

  • Immediate alerts upon denial
  • Structured resubmission workflows
  • Peer-to-peer coordination
  • Appeal tracking with accountability

5. Cross-Functional Authorization Teams ๐Ÿ‘ฅ

Top performers deploy:

  • Trained authorization specialists
  • Clinical coordinators for complex cases
  • Financial counselors for patient communication
  • Reduced physician administrative burden

Why Generic RCM Solutions Will Fail Under the 72-Hour Rule โŒ

Many traditional RCM vendors are not designed for compressed authorization timelines:

  • One-size-fits-all workflows ignore payer-specific rules
  • Manual escalation models cannot meet 72-hour turnaround demands
  • Limited analytics delay corrective action

The 2026 mandate requires precision, speed, and real-time insightโ€”not incremental optimization.

How RCAceSolutions Prepares Providers for 2026 and Beyond ๐Ÿ†

RCAceSolutions delivers revenue cycle infrastructure designed specifically for the CMS 2026 prior authorization mandate.

Our Structured Implementation Approach

Phase 1: Rapid Readiness (Weeks 1โ€“4)

  • Comprehensive authorization workflow audit
  • Bottleneck and revenue leakage analysis
  • Immediate process optimization
  • Staff training aligned with CMS timelines

Phase 2: System Optimization (Months 2โ€“3)

  • Automated intake and documentation integration
  • Real-time authorization dashboards
  • Denial management protocol deployment
  • Cross-team workflow alignment

Phase 3: Continuous Performance Excellence (Ongoing)

  • Monthly analytics and KPI reviews
  • Payer response optimization
  • Denial trend refinement
  • Proactive regulatory monitoring

The Bottom Line: Act Before the Mandate Acts on You โณ

The providers that thrive in 2026 will not be the largestโ€”they will be the most operationally disciplined.

They will:

  • Submit clean, complete authorizations
  • Track every request in real time
  • Respond to denials within hours
  • Protect physician productivity
  • Maintain predictable revenue cycles

The 72-hour mandate is no longer theoretical.
The only remaining question is whether your revenue cycle will be ready before preventable losses begin.

Ready to Future-Proof Your Revenue Cycle? โœ…

RCAceSolutions specializes in preparing healthcare organizations for the CMS 2026 prior authorization mandate.

This is not a sales callโ€”it is a revenue and compliance readiness assessment designed to identify risk before it impacts cash flow.

Protect your revenue. Optimize your operations. Empower your care teams.

References ๐Ÿ“š

  • Centers for Medicare & Medicaid Services (CMS), Interoperability and Prior Authorization Final Rule (CMS-0057-F)
  • American Medical Association (AMA), Prior Authorization Physician Survey Data
  • Health Affairs, Administrative Costs and Utilization Impact of Prior Authorization
  • Peer-reviewed studies on healthcare revenue cycle efficiency
  • Industry benchmarking data from multi-specialty healthcare systems

The 2026 CMS Prior Authorization Revolution: A Strategic Preparation Guide for Healthcare Leaders

By RCAceSolutions | Revenue Growth Partner

How Forward-Thinking Practices Are Turning Regulatory Change Into Competitive Advantage

๐ŸŽฏ Executive Summary

The healthcare administrative landscape is undergoing its most significant transformation in decades. On January 1, 2026, the CMS Interoperability and Prior Authorization Final Rule (CMS-0057-F) fundamentally restructures how prior authorizations function across Medicare Advantage, Medicaid, CHIP, and ACA Marketplace plans.

This isn’t just another compliance mandate. It’s a strategic inflection point that will separate operationally excellent practices from those struggling with legacy workflows.

The question isn’t whether to adaptโ€”it’s how strategically you’ll position your practice to capture the upside.

๐Ÿ“Š The Hidden Cost of Administrative Friction

Healthcare providers face a prior authorization burden that directly impacts both profitability and patient care quality.

Current State Metrics

Volume Reality:

  • Average physician completes 39-45 prior authorizations weekly
  • This consumes approximately 13 hours of combined staff time per week
  • 93% of physicians report measurable negative impacts on patient outcomes
  • 29% have documented serious adverse events linked to authorization delays

The Economic Impact

Consider the true cost structure. For a practice where physician time is valued conservatively at $500 per hour, the weekly opportunity cost approaches $6,500โ€”not spent on patient care, but navigating administrative requirements.

CMS projects these reforms will generate $15 billion in healthcare system savings.

The strategic question: Will your practice capture a proportional share of those efficiency gains, or will they accrue primarily to payers?

๐Ÿ”„ Four Regulatory Pillars Reshaping Prior Authorization

The final rule establishes new operational standards that extend beyond public payers as commercial insurers adopt similar frameworks.

1. Accelerated Response Requirements โฑ๏ธ

New Standards:

  • Urgent requests: 72-hour maximum response time
  • Standard requests: 7-calendar-day maximum response time

Strategic Implications:

Practices relying on manual tracking face elevated denial risk when information requests go unnoticed. The compressed timelines demand systematic monitoring and escalation protocols.

Competitive Advantage: Automated tracking systems with timestamp monitoring and alert workflows eliminate dependency on manual follow-up, ensuring compliance while reducing administrative burden.


2. Denial Transparency Requirements ๐Ÿ”

Payers must now provide specific, clinically relevant rationale for every denialโ€”ending the era of vague “not medically necessary” rejections.

Strategic Implications:

Increased data volume without analytical infrastructure creates information overload. Practices need systems that identify patterns, predict denial likelihood, and enable proactive documentation strategies.

Competitive Advantage: Denial intelligence platforms that categorize and trend payer behavior enable pre-emptive clinical documentation, significantly improving first-pass approval rates.


3. FHIR API Integration Mandate ๐Ÿ”—

Payers must implement Fast Healthcare Interoperability Resources (FHIR) APIs that connect directly with Electronic Health Record systems by January 2027.

Strategic Implications:

Basic API connectivity satisfies compliance but doesn’t guarantee operational efficiency. Many EHR implementations require significant configuration to optimize workflows.

Competitive Advantage: Purpose-built integrations can reduce submission time from 30+ minutes to under 5 minutes per authorization, dramatically improving throughput without additional staffing.


4. Public Performance Reporting ๐Ÿ“ˆ

Beginning March 2026, payers must publicly disclose:

  • Prior authorization approval rates by procedure category
  • Denial patterns and rationale distribution
  • Average response times across authorization types

Strategic Implications:

This transparency creates unprecedented negotiating leverage and network optimization opportunities.

Competitive Advantage: Data-driven practices will use payer performance metrics to:

  • Identify and exit consistently underperforming networks
  • Present evidence-based contract renegotiation proposals
  • Align scheduling and referral patterns with high-approval payers

๐Ÿ’ก The Financial Transformation Framework

For established practices, prior authorization optimization represents a significant margin expansion opportunityโ€”independent of patient volume growth.

Projected Impact: 5-Physician Multi-Specialty Practice

MetricManual BaselineOptimized SystemImprovement
Weekly Admin Hours65 hours19 hours-71%
Annual Admin Cost$101,400$29,640-$71,760
Initial Denial Rate28%5-8%-71-82%
Revenue RecoveryBaseline$150,000-220,000+$150-220K

ROI Components

  1. Direct cost reduction through decreased administrative time
  2. Revenue acceleration via faster authorization turnaround
  3. Denial prevention through predictive documentation
  4. Contract optimization using payer performance data

Conservative Projection: Well-executed optimization delivers $150,000+ in annual financial impact for a typical mid-sized practiceโ€”without increasing patient volume or expanding staff.

๐Ÿ—“๏ธ 90-Day Strategic Readiness Framework

Phase 1: Discovery & Baseline Assessment (Days 1-45) ๐Ÿ”

Objectives:

  • Quantify current prior authorization time investment by role
  • Analyze denial patterns by payer, procedure type, and provider
  • Assess existing EHR capabilities and FHIR readiness
  • Calculate true economic impact of current workflows

Deliverable: Comprehensive operational audit identifying top efficiency leakage points and quantified improvement opportunities.


Phase 2: Infrastructure & Process Redesign (Days 46-75) ๐Ÿ› ๏ธ

Objectives:

  • Eliminate fax-dependent submission workflows
  • Implement deadline-driven case management protocols
  • Establish escalation pathways for approaching deadlines
  • Configure EHR integration or evaluate specialized platforms
  • Train staff on urgency-based triage methodologies

Deliverable: Redesigned prior authorization workflow with automated tracking, standardized documentation templates, and clear accountability structures.


Phase 3: Launch & Continuous Optimization (Days 76-90+) ๐Ÿš€

Objectives:

  • Activate real-time SLA compliance monitoring
  • Establish baseline metrics for ongoing performance tracking
  • Analyze public payer performance data as it becomes available
  • Identify contract renegotiation opportunities based on comparative data
  • Implement continuous improvement protocols

Deliverable: Fully operational optimized system with quarterly review cadence and data-driven refinement process.

๐Ÿค Strategic Partnership Considerations

As practices evaluate their options, several pathways exist:

Option 1: EHR Vendor Solutions

Most major EHR platforms are developing compliant tools. Advantages include seamless integration; limitations often include workflow optimization and strategic configuration support.

Option 2: Specialized Prior Authorization Platforms

Purpose-built solutions offer advanced automation, analytics, and workflow optimization. Considerations include integration complexity and cost structure.

Option 3: Revenue Cycle Management Partners

Full-service RCM firms can assume complete prior authorization responsibility. Benefits include removing burden from internal staff; considerations include loss of direct process control.

Option 4: Hybrid Approach

Many leading practices combine EHR-native tools for straightforward cases with specialized support for complex, high-value authorizations.

๐ŸŽฏ Why Choose RCAceSolutions

RCAceSolutions transforms prior authorization from administrative burden into strategic advantage through:

๐Ÿ… Deep Expertise: ++ years of specialized Revenue Cycle Management across multiple specialties

๐Ÿ“ˆ Proven Performance: 87% appeal success rate with documented outcomes across diverse payer mix

โš™๏ธ Technology Integration: Seamless connectivity with major EHR platforms and proprietary analytics

๐ŸŽฏ Outcome Alignment: Performance-based engagement models with mutually agreed KPIs and guaranteed results

๐Ÿ”„ Continuous Optimization: Quarterly strategic reviews with actionable payer intelligence and contract optimization recommendations

Our approach aligns incentives completelyโ€”because sustainable results matter more than short-term fixes.

โœ… Action Items for Healthcare Leaders

Immediate (Next 30 Days):

  • Schedule operational audit with administrative leadership
  • Request FHIR readiness assessment from EHR vendor
  • Analyze Q3-Q4 2024 denial data by payer and procedure type
  • Calculate current fully-loaded cost of prior authorization process

Strategic (60-90 Days):

  • Evaluate technology solutions and partnership models
  • Develop 2026 prior authorization optimization budget
  • Establish baseline metrics for measuring improvement
  • Create staff training plan for new workflows

Ongoing (2026+):

  • Monitor public payer performance reporting data
  • Conduct quarterly contract reviews using comparative metrics
  • Refine documentation protocols based on denial patterns
  • Track ROI and adjust resource allocation accordingly

๐Ÿ“š References & Resources

Regulatory Sources:

Industry Research:

  • American Medical Association (2024). Prior Authorization Physician Survey: Administrative Burden and Patient Care Impact. AMA National Health Policy Conference.
  • CAQH (2024). CAQH Index: Measuring the Industry’s Progress Toward Electronic Business Transactions. Annual Report on Healthcare Administrative Efficiency.
  • Health Affairs Scholar (2023). Quantifying Administrative Waste in U.S. Healthcare Delivery. Vol. 1, Issue 4.

Technical Standards:

  • HL7 FHIR Foundation. Fast Healthcare Interoperability Resources (FHIR) Standard Documentation. Available at: https://www.hl7.org/fhir/

Additional Resources:

  • Office of the National Coordinator for Health IT (ONC). Interoperability Standards and Implementation Specifications.
  • National Committee for Quality Assurance (NCQA). Prior Authorization and Utilization Management Best Practices.

Denied Claims Average $5,390: How Expert RCM Turns Lost Revenue Into Predictable Growth ๐Ÿ’ธ

By RCAceSolutions | Revenue Growth Partner

The hidden $5,390 problem draining clinicsโ€”and the expert, human-led RCM system that recovers it.

Denied Claims: A Silent Revenue Leak for Clinics and Medical Practices ๐Ÿฅ

For clinic owners, practice administrators, and healthcare executives, denied claims are not just a billing inconvenienceโ€”they are a systemic revenue failure.

Based on aggregated healthcare revenue cycle benchmarks, the average denied claim represents approximately $5,390 in delayed or lost reimbursement. When denial rates hover between 5โ€“10% of total claims, many practices unknowingly forfeit six figures in annual revenue.

For a clinic generating $2 million per year, this often translates to $100,000โ€“$200,000 in recoverable revenue lost annually.

The most important truth: denied claims are not inevitableโ€”and most are recoverable with the right expertise, systems, and speed.

The True Cost of Denied Claims Goes Far Beyond Reimbursement ๐Ÿ“‰

The financial impact of denied claims extends well beyond the original charge amount. Denials disrupt operations, drain staff productivity, and destabilize cash flow.

Direct Financial Impact

  • ๐Ÿ’ต $25โ€“$117 average cost to rework each denied claim
  • โฑ๏ธ 15โ€“20 staff hours per week spent managing appeals in mid-sized clinics
  • ๐Ÿ•’ 30โ€“60 day delays in reimbursement
  • โŒ Up to 25% of claims older than 90 days ultimately written off

Operational Consequences

  • Administrative burnout and turnover
  • Reduced focus on patient care and growth initiatives
  • Unpredictable cash flow and budgeting challenges
  • Rising overhead eroding profit margins

Industry data shows average denial rates of 10โ€“15%, with some specialties exceeding 20%. Without expert intervention, these losses compound month after month.

Why Claims Are Denied: The Five Most Common Root Causes ๐Ÿ”

Sustainable revenue recovery begins with understanding why claims fail.

1. Patient Registration & Eligibility Errors (~30%)

Inaccurate demographics, outdated insurance information, or missed eligibility verification result in immediate denialsโ€”often from simple, preventable errors.

2. Authorization & Referral Gaps (~25%)

Changing payer rules make prior authorization and referral requirements difficult to manage without dedicated systems and oversight.

3. Coding & Documentation Errors (~20%)

Incorrect CPT or ICD-10 codes, bundling issues, or insufficient documentation frequently trigger payer rejections.

4. Timely Filing Misses (~15%)

Each payer enforces strict submission deadlines. Missing these windows permanently eliminates reimbursement.

5. Duplicate Claims & Coordination of Benefits Issues (~10%)

Coverage changes, secondary payer confusion, and system duplication errors lead to avoidable denials.

Key insight: The majority of denials are predictableโ€”and preventableโ€”with proactive, expert-led controls.

Why Traditional Billing Models Fail to Stop Denials ๐Ÿšซ

Most in-house billing teams and software-only RCM platforms operate reactivelyโ€”addressing denials after revenue is already delayed.

Common limitations include:

  • Overreliance on automation without expert oversight
  • Generic workflows that ignore payer-specific nuances
  • Slow response times that allow claims to age
  • Limited appeal expertise and follow-through

The result is a cycle of recurring denials, staff frustration, and permanently lost revenue.

The Expert RCM Advantage: From Reactive Billing to Revenue Control ๐Ÿš€

Expert Revenue Cycle Management replaces reactive billing with prevention-first, recovery-driven systems supervised by experienced RCM professionals.

Prevention-First Revenue Architecture

  • Real-time eligibility verification
  • Automated prior authorization tracking
  • Pre-submission coding and compliance validation

These controls reduce initial denial rates by up to 40โ€“50%, based on industry performance benchmarks.

Intelligent Denial Management

Expert RCM teams analyze denial trends by payer, procedure, and providerโ€”implementing permanent fixes rather than repetitive resubmissions.

Payer-Specific Appeal Expertise

With deep knowledge of payer rules and escalation pathways, expert teams achieve appeal success rates of 60โ€“75%, compared to industry averages of 35โ€“40%.

Speed-Driven Recovery

Claims worked within 48โ€“72 hours dramatically outperform aged claims, which see recovery rates fall below 30% after 90 days.

The RCAceSolutions Human-Led RCM Framework ๐Ÿง 

RCAceSolutions delivers measurable results by combining experienced human RCM experts with advanced technologyโ€”not replacing people with software, but empowering them.

Phase 1: Revenue Diagnosis & Benchmarking

  • Denial rate analysis by payer and category
  • Identification of revenue leakage points
  • Workflow and staff efficiency assessment
  • Technology and process optimization review

Phase 2: Denial Prevention Systems

Front-End Revenue Protection

  • Real-time eligibility verification at scheduling
  • Prior authorization tracking and management
  • Patient data accuracy validation

Coding & Documentation Excellence

  • Certified, specialty-focused medical coders
  • Continuous payer policy monitoring
  • Advanced claim scrubbing catching most errors pre-submission

Phase 3: Aggressive Denial Recovery

  • Denials addressed within 48 hours of notification
  • Payer-specific appeal strategies
  • Clinical documentation support for medical necessity
  • Structured escalation for complex claims

Phase 4: Continuous Optimization

  • Monthly performance and trend reviews
  • Rapid adaptation to payer policy changes
  • Ongoing staff education
  • Continuous system and workflow enhancements

Why Expert RCM Consistently Delivers ROI ๐Ÿ’ก

Recovering just three denied claims per month at the $5,390 average equates to over $190,000 annuallyโ€”often exceeding the total cost of professional RCM services.

Beyond revenue recovery, expert RCM delivers:

  • Reduced provider and staff burnout
  • Improved compliance and audit readiness
  • Enhanced patient experience through accurate billing
  • Stronger competitive and financial positioning

Take Control of Your Revenueโ€”Starting Now ๐Ÿ“ˆ

Denied claims are not a cost of doing business. They are a recoverable growth opportunity.

Your Next Steps

  1. Request a Free Revenue Assessment
  2. Receive a Custom Recovery Projection
  3. Review a Clear Implementation Roadmap
  4. Partner with confidence through measurable performance commitments

Stop allowing $5,390 denials to erode your margins.

๐Ÿ‘‰ Contact RCAceSolutions today and turn denied claims into predictable, sustainable revenue growth.

About RCAceSolutions

RCAceSolutions specializes in expert Medical Billing and Revenue Cycle Management services exclusively for clinics and healthcare providers. Our human-led, technology-enabled approach prevents denials, accelerates recovery, and optimizes long-term financial performanceโ€”so providers can focus on delivering exceptional patient care.

References ๐Ÿ“š

  • American Medical Association (AMA): Claims Denial and Appeals Benchmarks
  • Medical Group Management Association (MGMA): Revenue Cycle Performance Metrics
  • Centers for Medicare & Medicaid Services (CMS): Claims Processing Guidelines
  • Aggregated Payer Policy and Healthcare RCM Industry Reports

๐Ÿšจ 41% of Practices Report Double-Digit Denial Rates

By RCAceSolutions | Revenue Growth Partner

The Silent Revenue Crisis Crushing Healthcare Practices โ€” and How Top Performers Are Beating It

You deliver high-quality patient care.
Your clinicians document appropriately.
Your team follows payer protocols.

Yet despite doing โ€œeverything right,โ€ denials keep coming.

Claims return with vague codes.
Payments stall in appeal backlogs.
Revenue that should already be in your account remains trapped in limbo.

If this sounds familiar, you are not alone. And more importantlyโ€”this problem is accelerating.

๐Ÿ“ˆ The Alarming Reality: Denial Rates Are Climbing Fast

Recent industry research reveals a sobering trend:

  • 41% of healthcare practices report denial rates of 10% or higher
  • Initial denial rates reached 11.8% in 2024, up from 10.2% just a few years ago
  • Many clinics now experience denial rates of 15% or more

๐Ÿ”Ž What This Means in Real Dollars

If your clinic submits 1,000 claims per month at an average reimbursement of $200:

  • A 10% denial rate = 100 denied claims
  • Even if you recover half, you lose $10,000 per month
  • Thatโ€™s $120,000 per year in lost revenueโ€”before factoring in staff rework costs

And hereโ€™s the most critical insight:

Nearly 90% of claim denials are preventable.

๐Ÿ’ธ The $260 Billion Denial Crisis No One Talks About

Claim denials are no longer an operational inconvenienceโ€”they are a systemic revenue crisis.

  • Payers deny approximately $260 billion in claims annually
  • Hospitals lose an average of $5 million per year to denials
  • Healthcare organizations spend $19.7 billion annually managing and appealing denied claims

โš™๏ธ The Cost of One Denial

  • Medicare Advantage denial rework: $47.77 per claim
  • Commercial payer denial rework: $43.84 per claim

๐Ÿš€ And Itโ€™s Getting Worse

  • Medicare Advantage denials increased nearly 56% year over year
  • Commercial plan denials rose over 20%
  • AI-driven claim reviews are denying claims at unprecedented scale

๐Ÿค– Why Denials Are Hitting Practices Harder Than Ever

The denial surge is driven by a perfect storm of industry forces:

๐Ÿ”น Increasingly Complex Payer Policies

Frequent policy changes, stricter medical necessity criteria, and inconsistent prior authorization requirements create constant risk.

๐Ÿ”น AI-Powered Claim Reviews

Payers now use automated systems to deny claims in secondsโ€”often without clinical context. Some reports show hundreds of thousands of claims denied in weeks, many later deemed inappropriate.

๐Ÿ”น Administrative & Eligibility Errors

Outdated insurance data, demographic mismatches, and missed authorizations trigger thousands of avoidable denials daily.

๐Ÿ”น Documentation & Coding Gaps

Up to 49% of claims are impacted by routine documentation or coding issuesโ€”problems that require prevention, not rework.

๐Ÿง  The Hidden Costs Destroying Practice Performance

Denials hurt far more than revenue:

  • ๐Ÿ’ฐ Cash Flow Disruption: Increased AR days and delayed reimbursements
  • ๐Ÿง‘โ€๐Ÿ’ผ Staff Burnout: Endless rework, appeals, and payer follow-ups
  • ๐Ÿฉบ Reduced Patient Focus: Less time spent on patient care
  • ๐Ÿ“‰ Lower Patient Satisfaction: Patients facing denials score care 8.2 points lower
  • โŒ Permanent Revenue Loss: Nearly 60% of denied claims are never resubmitted

๐Ÿ“Š The 3 Denial Categories Impacting Clinics the Most

1๏ธโƒฃ Administrative & Eligibility Issues (77% of denials)

  • Registration errors
  • Insurance verification gaps
  • Missing or expired authorizations
  • Timely filing violations

โœ… Highly preventable with proper front-end controls


2๏ธโƒฃ Medical Necessity & Coverage Disputes

  • Payer challenges to physician-directed care
  • Requests for additional documentation
  • Increasing scrutiny of utilization

โณ Often require expert-led appeals


3๏ธโƒฃ Coding & Billing Errors

  • Incorrect CPT/ICD combinations
  • Missing modifiers
  • Duplicate or mismatched claims

๐Ÿ› ๏ธ Preventable with intelligent pre-submission review

๐Ÿ† What High-Performing Practices Do Differently

While 41% struggle, top practices consistently maintain denial rates below 5%.

Their approach is strategicโ€”not reactive.

They:

  • Treat denial prevention as an enterprise-wide priority
  • Use analytics to identify root causes
  • Fix issues before claims are submitted
  • Combine technology with human RCM expertise
  • Partner with specialists who understand payer behavior deeply

๐Ÿš€ How RCAceSolutions Transforms Denial Management

RCAceSolutions was built for one purpose:
Protect your revenue so you can focus on patient care.

๐Ÿ›‘ Proactive Denial Prevention

We stop denials before they happen through:

  • Eligibility & insurance validation
  • Prior authorization verification
  • Coding and documentation checks
  • Payer-specific compliance review

๐Ÿ“‰ Clients typically see 30โ€“50% reductions in initial denials within six months.


๐Ÿ“Š Intelligent Analytics (With Human Oversight)

Our real-time dashboards reveal:

  • Denials by payer, service, and root cause
  • Financial impact on cash flow
  • Benchmark comparisons
  • Training and workflow gaps

Technology flags the issueโ€”our experts interpret and fix it.


๐Ÿง‘โ€โš•๏ธ Expert-Led Denial Resolution

When denials occur, our specialists:

  • Identify appeal viability immediately
  • Assemble payer-specific documentation
  • Submit timely, compliant appeals
  • Follow through until resolution

๐Ÿ’ฐ We recover 40โ€“60% of denied claimsโ€”revenue most practices write off.


๐Ÿ”„ Continuous Improvement, Not Band-Aids

Every denial becomes a data point for improvement:

  • Workflow optimization
  • Targeted staff education
  • Documentation enhancement
  • Payer-specific strategy refinement

๐Ÿ”— Seamless Integration, Zero Disruption

We integrate with your existing EHR and PM systems while your team continues caring for patients.

Whether you are:

  • A solo practice
  • A multi-location group
  • A specialty clinic
  • A hospital-affiliated provider

Our approach adapts to you.

โณ Take Control of Your Revenueโ€”Now

Denials are not slowing down.
Payers are becoming more automated, aggressive, and complex.

The question is simple:

Will you continue reactingโ€”or start preventing?

If your practice is among the 41% with double-digit denial rates, every delayed decision costs revenue you will never recover.

โœ… Ready to See What Youโ€™re Leaving on the Table?

๐Ÿ“Š Schedule a Complimentary Denial Analysis

In a short session, we will:

  • Identify your top 3 denial root causes
  • Quantify exact revenue leakage
  • Show how much you can recoverโ€”and prevent

No obligation. Just clarity.

๐Ÿฅ About RCAceSolutions

RCAceSolutions is a trusted revenue cycle management partner specializing in denial prevention, analytics, and expert-led resolution. We combine advanced technology with seasoned human expertise to help healthcare practices protect revenue, reduce administrative burden, and achieve long-term financial stability.

๐Ÿ“ฉ Contact us today to transform your revenue cycle into a competitive advantage.

๐Ÿ“š References

  • Journal of Managed Care & Specialty Pharmacy โ€“ Claim Denial Trends
  • American Medical Association (AMA) โ€“ Prior Authorization Impact Studies
  • MGMA โ€“ Medical Practice Financial Indicators
  • CMS โ€“ Medicare Advantage Claims & Appeals Data
  • HFMA โ€“ Revenue Cycle Benchmark Reports
  • Change Healthcare โ€“ Denials & Cost of Rework Analysis

๐Ÿ’ฐ The $19.7 Billion Appeals Burden: Why Denial Prevention Is the Highest-ROI Move in Healthcare RCM

By RCAceSolutions | Revenue Growth Partner

Every claim denial that reaches your billing team is more than a delayed paymentโ€”it is a direct hit to cash flow, margins, and operational efficiency. On average, reworking a single denied claim costs healthcare providers anywhere from $25 to $181, depending on complexity and payer requirements.

For organizations already operating on razor-thin margins, this is no longer a manageable inefficiency. It is a systemic revenue leak.

In 2023 alone, healthcare providers spent $19.7 billion appealing denied claims, with the average cost per appealed claim reaching $43.84. That is nearly $20 billion spent fighting for reimbursement that should have been paid correctly the first time. For CFOs, COOs, and revenue leaders, the implication is clear: denial rework is quietly eroding EBITDA and restricting growth.

โš ๏ธ The Hidden Cost of Playing Defense

Denial management may feel necessaryโ€”but it is fundamentally reactive. When your revenue cycle team spends its time chasing denials, the organization pays far beyond the appeal itself.

๐Ÿ“Š Industry realities reveal the scale of the problem:

  • Nearly 15% of all medical claims submitted to private payers are initially denied
  • 54% of denied claims are ultimately overturned on appeal
  • 62% of prior authorization denials are reversed when appealed

In other words, more than half of denied claims should never have been denied at all.

Meanwhile:

  • Claims adjudication costs providers $25.7 billion annually
  • Approximately $18 billion of that spend is potentially unnecessary
  • Administrative costs tied to claims submission have increased by 83% in recent years
  • The U.S. healthcare system now spends $60 billion annually on administrative tasks alone

This is not a billing issueโ€”it is an enterprise-level operational inefficiency.

๐Ÿฅ The Real Impact on Your Organization

Denials donโ€™t stay confined to the billing department. Their effects ripple across the entire organization.

๐Ÿ’ธ Financial Stability Takes a Hit

Hospital days cash on hand have fallen to 196.8 days, the lowest level in a decade. Delayed or denied reimbursement restricts liquidity, limits investment in technology and patient care, and can even lead to bond rating downgrades, increasing the cost of capital.

๐Ÿ˜“ Staff Burnout Accelerates

Billing and coding teams spend countless hours gathering documentation, navigating payer portals, and managing appeals.

  • 84% of healthcare organizations report rising compliance costs tied to payer policies
  • 95% report staff spending more time on prior authorizations than ever before

This repetitive, high-friction work contributes directly to burnout, turnover, and lost productivity.

๐Ÿ‘ฅ Patient Experience Suffers

Patients caught in the middle of claim disputes rate their care 8.2 points lower on CAHPS satisfaction scores, even when claims are eventually paid. Lower satisfaction directly impacts value-based reimbursement, reputation, and patient retention.

๐Ÿš€ Why Denial Prevention Outperforms Appealsโ€”Every Time

From a financial standpoint, the equation is simple:

๐Ÿ‘‰ Preventing a denial costs a fraction of what it takes to reverse one.

Appeals consume hours of staff time across departments. Prevention requires minutesโ€”often automatedโ€”before a claim is submitted.

Organizations that invest in front-end denial prevention consistently outperform those focused on post-denial recovery. Why? Because prevention fixes problems at the source, not after revenue has already stalled.

๐Ÿงฉ The Four Pillars of Effective Denial Prevention

โœ… Real-Time Eligibility Verification
Automated eligibility checks before services are rendered prevent 46% of denials related to missing or inaccurate patient informationโ€”the single most common rejection cause.

โœ… Accurate Clinical Documentation
Incomplete or inconsistent documentation drives medical necessity denials. Supporting clinicians with real-time documentation guidance dramatically reduces downstream rework.

โœ… Pre-Authorization Management
Despite approval, 3.2% of claims are still denied due to authorization mismatches. Tracking payer-specific rules during scheduling prevents these costly errors.

โœ… Automated Claims Scrubbing
Advanced claims validation technology flags coding errors, missing data, and policy conflicts before submission, when fixes are fast and inexpensive.

๐Ÿค– The Technology Advantageโ€”When Paired With Human Expertise

Only 31% of providers currently use automation in claims management. Those that do experience lower denial rates, faster reimbursement cycles, and reduced administrative burden.

Predictive analytics now identify claims most likely to be denied before they are submitted. High-risk claims are flagged early, allowing teams to resolve issues proactively rather than reactively.

๐Ÿ“Œ Research indicates that 86% of denials are preventable with the right combination of technology, workflows, and expert oversight.

The key distinction: technology enhances human expertiseโ€”it does not replace it. The most successful organizations combine automation with experienced RCM professionals who understand payer nuance and clinical complexity.

๐Ÿ”„ The Strategic Shift Healthcare Leaders Are Making

Forward-thinking healthcare organizations are reallocating resources away from denial firefighting and toward denial prevention strategies that deliver measurable ROI.

This shift includes:

  • Root cause analysis to identify denial patterns
  • Automation to intercept errors before submission
  • Cross-department alignment between registration, coding, billing, and clinical teams
  • Ongoing education around evolving payer rules

๐Ÿ“ˆ The results:

  • Fewer denials
  • Faster reimbursement
  • Lower administrative costs
  • Improved staff morale and retention
  • Better patient satisfaction
  • Stronger, more predictable cash flow

๐Ÿ† How RCAceSolutions Transforms the Revenue Cycle

RCAceSolutions helps healthcare organizations move from expensive denial management to proactive, prevention-first revenue cycle excellence.

๐Ÿ”น Comprehensive Front-End Solutions
Robust patient registration and real-time eligibility verification ensure coverage clarity before care is delivered.

๐Ÿ”น Intelligent Coding & Documentation Support
Integrated EHR guidance supports accurate documentation and coding at the point of careโ€”reducing medical necessity denials.

๐Ÿ”น Automated Claims Validation
Advanced claims scrubbing checks every submission against current payer rules before it leaves your organization.

๐Ÿ”น Data-Driven Performance Analytics
Actionable insights reveal denial trends by payer, service line, and providerโ€”enabling continuous improvement.

๐Ÿ”น Measurable Results
Organizations working with RCAceSolutions typically achieve:

  • ๐Ÿ“‰ 30โ€“50% reduction in denial rates within six months
  • ๐Ÿ“Š Higher first-pass acceptance rates
  • โฑ๏ธ 15โ€“25% reduction in A/R days
  • ๐Ÿ‘ฉโ€๐Ÿ’ผ Improved staff productivity and morale

โœ… The Bottom Line: Prevention Pays

The $19.7 billion spent annually on appeals represents massive opportunity costโ€”money that could be reinvested in patient care, staffing, innovation, and growth.

Denial prevention is not just a cost-saving tactic. It is a strategic imperative.

With denials costing up to $181 per claim to resolve, the real question for healthcare leaders is no longer โ€œCan we afford prevention?โ€

๐Ÿ‘‰ Itโ€™s: Can we afford not to?

๐Ÿ“ž Ready to Reduce Denials and Strengthen Cash Flow?

A focused assessment can reveal where preventable denials are quietly draining your revenue today.

Contact RCAceSolutions to learn how a prevention-first approach can stabilize your revenue cycle and put more dollars back into patient care.

RCAceSolutions โ€” Your partner in proactive revenue cycle excellence.

๐Ÿ“š References

  • American Hospital Association (AHA) Administrative Cost Studies
  • MGMA Revenue Cycle Benchmarks
  • Change Healthcare Denials & Appeals Index
  • CAQH Index: Administrative Simplification
  • CMS & Commercial Payer Prior Authorization Reports

๐Ÿ“‰๐Ÿ‘จโ€โš•๏ธ Medicare Advantage Denials Jump 4.8%: Why 2026 Requires Expert-Led RCM Defenseโ€”not Just Technology

By RCAceSolutions | Revenue Growth Partner

Your clinic submits a perfectly documented Medicare Advantage claim. No coding gaps. No clinical ambiguity. Yet weeks laterโ€”a denial hits your inbox.

This isnโ€™t a glitch. Itโ€™s the new payer operating model.

Between 2023 and 2024, Medicare Advantage (MA) denial rates rose 4.8%, with initial denials across all payers reaching 11.8%. For clinics already operating on thin margins, these escalating denials jeopardize revenue, stability, and care delivery.

But whatโ€™s changing in 2026 is bigger than numbersโ€”itโ€™s the rise of AI-driven denials with minimal human oversight. And this new environment cannot be navigated by software alone.

It requires deeply specialized RCM experts who understand payer behavior, regulatory nuance, clinical interpretation, appeal strategy, and denial root causes at a level that machines cannot replicate.

๐Ÿ“Š The Economic Reality Behind the 2026 Denial Crisis

Medicare Advantage leads all lines of business in denials.

MA initial denial rates hit 15.7%, nearly double traditional Medicare.

Systemicโ€”not incidentalโ€”denials.

41% of providers experience denial rates over 10%, and rising.

The financial consequences are structural.

Providers lose:

  • 7% of MA revenue even after appeals
  • ~$5M annually for an average-size clinic
  • Weeks in A/R delays on overturned denials

Service lines at highest risk:

  • Post-acute care
  • Long-term acute care
  • Home health
  • Orthopedics
  • Cardiology
  • Chronic care management

All disproportionately impacted by AI-driven denials.

๐Ÿค– The AI Factor: Technology Is Now Working Against You

Payers have shifted to a model where AI systemsโ€”not cliniciansโ€”screen, flag, and deny claims at scale.

These systems:

  • Auto-deny claims based on narrow algorithmic criteria
  • Trigger batch denials for minor coding discrepancies
  • Fail to account for clinical complexity
  • Override physician judgment

A Senate Finance report revealed AI-driven denial rates up to 16x higher than human review.
Doctors confirm this trendโ€”61% fear AI-based utilization review is replacing clinical logic with automation bias.

Hereโ€™s the critical truth:

The only effective counter to payer AI is HUMAN RCM EXPERTISE.
Technology alone cannot argue medical necessity, interpret clinical nuance, or construct winning appeals.

This is why 2026 demands a return to expert-led revenue cycle defense.

๐Ÿ“ˆ Why Denials Will Intensify Again in 2026

Three forces converge:

1. Expanded utilization management and prior authorization

PA volume is increasing, and denials for MA prior auth are at 7.4%, up sharply from previous years.

2. AI-driven batch denials without human review

Payer algorithms reject based on:

  • Code-to-documentation mismatch
  • Missing modifiers
  • Timing issues
  • Unsupported clinical data (even when clinically appropriate)

Only trained RCM professionals can identify, interpret, and correct these nuanced traps.

3. Financial pressure on MA plans

Plans will intensify denials due to:

  • Payment adjustments
  • Risk model updates
  • Margin compression

This guarantees higher denial activityโ€”especially automated denialsโ€”through 2026.

๐Ÿ’ผ The Hidden Cost: Bad Denials Win the First Round, but Experts Win the Fight

57% of MA denials are overturned on appealโ€”proof they should never have happened.

But overturning them requires:

  • Expert coding judgment
  • Clinical documentation interpretation
  • Regulatory understanding
  • Strong payer negotiation skills
  • Strategic appeal drafting

Clinics without expert-led denial teams lose millionsโ€”not because the claims were wrong, but because the clinic lacked the time, knowledge, or staff to fight back.

๐Ÿง  2026 Policy Shifts: Human Interpretation Matters More Than Ever

CMS changes for 2026 include:

  • Limits on reopening approved inpatient admissions
  • Stronger provider due-process rights
  • Stricter provider directory requirements

But CMS did not finalize criteria definitions, uniform appeal pathways, or oversight mechanisms.
This means your protection depends on your teamโ€™s expertise, not regulatory guardrails.

๐Ÿ›ก๏ธ State-Level Protections: Again, Only Experts Can Navigate Them

New state lawsโ€”like Californiaโ€™s physician-review mandateโ€”require deep understanding of medical necessity rules, clinical criteria, and documentation standards.

Technology cannot navigate these changes.
Experienced RCM specialists can.

๐Ÿ‘จโ€โš•๏ธ How RCAceSolutionsโ€™ Human RCM Experts Turn Denial Pressure Into Revenue Protection

Expert-Led. Technology-Supported. Results-Driven.

Unlike payer AI systems that deny automatically, our experts intervene manually, strategically, and intelligentlyโ€”ensuring every claim is evaluated with human judgment and payer-specific insight.

๐ŸŽฏ Our Expert-Centric Approach

1. Expert-Led Denial Prevention

Our RCM professionals audit documentation, coding, and authorization requirements before submission, identifying denial triggers algorithms would flag.

2. Medicare Advantage Specialists Who Know Every Payer Tactic

Our experts understand:

  • MA medical necessity policies
  • Coverage criteria
  • Authorization rules
  • Appeal pathways
  • Payer-specific loopholes and timing traps

This insider-level knowledge cannot be automated.

3. Human-Driven Root Cause Analysis

Our analysts identify patterns payer algorithms target and correct them proactively.

4. Litigation-Level Appeals Crafted by RCM Strategists

We write clinical, regulatory, and policy-backed appeal arguments that machinesโ€”and inexperienced billersโ€”cannot replicate.

5. Technology Under Expert Supervision

AI tools assist with scrubbing and flagging, but humans make all final decisions and validations to outperform payer AI.

6. Real-Time Transparency

Our experts provide interpretive analysisโ€”not just dashboardsโ€”so you understand the โ€œwhy,โ€ not just the numbers.

๐Ÿ“ˆ The RCAceSolutions Performance Advantage

Because our model is human-expertโ€“driven, our clients see:

  • 30โ€“50% reduction in initial denials
  • 70%+ success rate on appeals
  • 3โ€“7% increase in net patient revenue
  • Faster cash flow and reduced A/R days
  • Dramatically reduced staff administrative load

When payer AI denies at scale, human expertise is the only competitive advantage.

๐Ÿ“ Your Expert-Led 2026 Readiness Plan

Immediate (Next 30 Days)

  • Conduct expert review of denial reason codes
  • Identify payer-specific denial triggers
  • Analyze documentation and coding vulnerabilities
  • Review MA policies with a human specialist

60-Day Optimization

  • Update documentation templates based on expert feedback
  • Train clinical teams on payer-specific risk patterns
  • Establish an expert-led PA accuracy program
  • Strengthen medical necessity support structures

90-Day Protection Framework

  • Deploy RCAceSolutions expert-driven denial management
  • Establish escalation pathways for high-risk claims
  • Monitor and interpret payer AI denial patterns
  • Set quarterly denial reduction and overturn targets

Your 2026 survival strategy must begin nowโ€”and it must be led by people, not software.

๐Ÿ“Œ Bottom Line

Medicare Advantage denials are rising.
Payer AI is accelerating.
2026 will be the most challenging revenue year yet.

But software alone wonโ€™t save your clinic.

Expert-led RCM is the only sustainable defense against automated payer systems and the only path to Full Revenue Recovery.

RCAceSolutions provides the human judgment, payer expertise, and strategic oversight needed to protect your revenue and stabilize your operations.

Ready to see what expert-led denial management can recover for your clinic? Contact us today for a FREE Revenue Assessment

Your staff deserves expert support.
Your revenue deserves expert protection.
Your clinic deserves expert-led RCM.

๐Ÿ“š References

  • CMS Medicare Advantage & Part D Final Rule (2026)
  • MedPAC Medicare Advantage Data Book
  • Senate Finance Committee Report on Payer AI Practices
  • American Hospital Association: Prior Authorization Burden Survey
  • MGMA Regulatory Burden Report
  • OIG Reports on Medicare Advantage Denials
  • Kaiser Family Foundation MA Oversight Analyses
  • California Physician Review Legislation Documentation

๐Ÿฅ Claim Denials Surge to 13.2% in 2025: The Hidden Revenue Leak That Will Devastate Medical Practices in 2026

By RCAceSolutions | Revenue Growth Partner

As 2025 closes, healthcare providers are preparing for a new year filled with rising costs, shrinking margins, and payer behaviors that continue to tighten reimbursement.
But the biggest financial threat heading into 2026 isn’t inflation, staffing shortages, or technology disruption.

๐Ÿ‘‰ Itโ€™s the unprecedented surge in claim denialsโ€”now averaging 13.2% in late 2025.
๐Ÿ‘‰ Up from 11.8% in 2024 and 10.2% just five years ago.

For a clinic processing 9,200 claims monthly, this now translates into $1.02 million in potential annual revenue loss entering 2026โ€”even before calculating appeal costs, labor hours, and cash flow delays.

If your practice is heading into the new year with unstable reimbursements, increasing AR, or denial backlogs, this โ€œsilent leakโ€ may be the hidden force sabotaging your 2026 financial strategy.

๐Ÿ“‰ The 2026 Financial Landscape: Practices Cannot Afford Denial Bleed

The upcoming year is shaping up to be one of the most challenging revenue cycles in a decade.

  • Payers are tightening approvals.
  • Medicare Advantage enrollment continues to rise.
  • Staffing turnover remains high.
  • Administrative burden is projected to grow 7โ€“10% in 2026.

And while health systems have the scale to absorb fluctuation, independent practices and mid-sized clinics are the most at risk, especially as payer policies evolve.

๐Ÿ” The Real 2026 Cost of Denials

1๏ธโƒฃ Direct Revenue Loss Intensifies

New 2025 data shows each denied claim now costs an average of $121, driven by rising labor and documentation demands.
For practices with modest volumes, these micro-losses accumulate into six- or seven-figure losses by Q4 2026.

2๏ธโƒฃ Higher Administrative Costs Going Into 2026

With authorization and documentation rules tightening:

  • Prior authorization review costs exceed $46 per claim
  • Multi-round appeals continue to consume 19โ€“33 minutes of staff time per denial
  • Medicare Advantage denial appeals require longer timelines and more clinical review

These operational inefficiencies push administrative spending to record highs.

3๏ธโƒฃ Denial Abandonment Will Be Worse in 2026

The abandonment rateโ€”already 65%โ€”is projected to rise due to staffing shortages and payer AI load.

Worse, 62% of resubmitted claims re-deny, meaning the revenue is often unrecoverable.

4๏ธโƒฃ Cash Flow Risk Expands

With payers extending adjudication timelines, 2026 cash flow deterioration may worsen, particularly for practices whose operations depend on 15โ€“30 day reimbursement cycles.

๐Ÿ“ˆ Why Denials Will Skyrocket Even More in 2026

The drivers behind 2026โ€™s projected denial spike are clearโ€”and deeply concerning.

๐ŸŒ€ 1. Increased Payer Policy Changes Set for 2026

Commercial plans, Medicare Advantage, and Medicaid programs are updating:

  • Prior authorization requirements
  • Medical necessity policies
  • Documentation standards
  • Filing deadlines

Providers unable to adapt will see their denial rate climb rapidly.

๐Ÿค– 2. AI-Driven Mass Denial Systems in Full Deployment

In 2024โ€“2025, payers tested AI-driven denial automation.
In 2026, full rollout begins, meaning:

  • Faster denials
  • Larger denial batches
  • Minimal manual review
  • Higher false-denial volume

Cases of hundreds of thousands of mass-denied claims are expected to increase.

๐Ÿ“‘ 3. Administrative Denials Will Dominate 2026

Still responsible for 77% of denials, administrative errors will be the #1 preventable loss category:

  • Coding mismatches
  • Missing/incorrect authorizations
  • Eligibility misalignment
  • Documentation gaps
  • Duplicate or late submissions

These causes will intensify as payers tighten their rules for the new year.

๐Ÿง“ 4. Medicare Advantage Enrollment Will Surge Again

With over half of eligible seniors now in MA plans, and enrollment projected to grow 3โ€“5% in 2026, denial complexity will follow.

MA plans reported a 5.3% denial increase in 2025, and this upward trend will continue into 2026.

๐Ÿงฉ The Ripple Effect: 2026 Will Bring More Than Lost Revenue

๐Ÿงโ€โ™‚๏ธ 1. Patient Care Delays Will Increase

MA and commercial plan discharge and pre-approval denials delay treatment and drive avoidable hospital days.

๐Ÿ˜Ÿ 2. Lower Patient Satisfaction

Patients facing denials in 2025 rated their experience 8โ€“10 points lowerโ€”and 2026 is expected to see even more dissatisfaction due to stricter policies.

๐Ÿ”ฅ 3. Billing Staff Exhaustion

Staffing turnover and payer complexity entering 2026 create:

  • High burnout
  • Declining accuracy
  • Longer AR cycles
  • Higher payroll costs

๐Ÿ“‰ 4. Quality Score Vulnerability

As payers leverage performance metrics for negotiation, increased denials can further hurt contract rates and future reimbursements.

โŒ Why Most Practices Will Fail in 2026 With a Reactive Approach

The old playbook no longer works.
Reactively fixing denials after they occur guarantees:

  • Higher write-offs
  • Endless appeals
  • Rising AR days
  • Chronic staff overwhelm
  • Unpredictable cash flow

And with denial volumes increasing in 2026, this model becomes financially irresponsible.

๐Ÿš€ How RCAceSolutions Prepares Practices for the 2026 Denial Surge

As denial rates rise heading into 2026, most healthcare organizations are turning to automation alone โ€” but technology without expert oversight still fails to prevent revenue leakage.
This is where RCAceSolutions stands apart.

Our approach is built on a Human-Led, Technology-Accelerated RCM Model, ensuring that every automated system is trained, supervised, and continuously refined by seasoned RCM Specialists who understand the nuances that software alone cannot detect.

๐Ÿ›ก๏ธ Hereโ€™s how our Human RCM Experts safeguard your revenue in 2026:

๐Ÿ‘ฉโ€๐Ÿ’ผ 1. Expert Oversight on Every Automation Workflow

Our RCM experts design, audit, and supervise all automated processesโ€”from eligibility checks to denial categorization.
They ensure that AI follows clean, compliant, and revenue-focused logic, minimizing errors and elevating accuracy.


๐Ÿง  2. Human Intelligence for Denial Patterns & Root Causes

Software identifies patterns.
Experts identify why they happen.
Our denial specialists interpret complex payer behavior, catch exceptions automation might miss, and implement strategic fixes before they become recurring revenue losses.


๐Ÿ”ง 3. Expert-Led Resolution of Complex DenialS

Not all denials can be resolved by bots.
Our certified RCM professionals handle:

  • Medical necessity disputes
  • Coding clarifications
  • Appeal narratives
  • Payer-specific negotiation
  • Documentation escalation
    This ensures high success rates even for complicated cases.

๐Ÿ›  4. Continuous Optimization (Humans Training the Tech)

Our RCM experts regularly update rule engines, automation logic, and AI prompts based on real-time payer changes and denial trends.
The result?
Your automation gets smarter every month, not outdated every quarter.


๐Ÿ“Š 5. Human Validation for High-Value Claims

Before submission, high-value claims undergo manual expert validation, reducing the risk of costliest denials.

๐Ÿค 6. Human-to-Human Payer Communication

When payers push back, our specialists step in:
โœ” Phone calls
โœ” Peer-to-peer follow-up
โœ” Document resubmissions
โœ” Clarifications
This human touch dramatically improves resolution turnaround time.

โญ The RCAceSolutions 2026 Results Practices Can Expect

  • 92โ€“96% Clean Claim Rate
  • 15โ€“18% Cash Flow Improvement in Q1โ€“Q2 2026
  • 45% Fewer Denials Within 90 Days
  • 2ร— Faster Denial Resolution
  • 70โ€“75% Appeal Overturn Success Rate

In 2026, efficiency isnโ€™t just an advantage โ€” itโ€™s survival.

๐ŸŽฏ Why RCAceSolutions Is the 2026 Partner Practices Need

๐Ÿ’ผ Performance-Based Model

Only pay when we deliver results โ€” perfect for 2026โ€™s tight budgets.

๐Ÿ”„ EHR-Agnostic Integration

Works with your current systems with zero workflow disruption.

๐Ÿค A Long-Term 2026 Growth Partner

You gain a strategic team, not just software access.

๐Ÿง  2026-Focused Revenue Cycle Intelligence

We monitor policy shifts, payer behaviors, and denial patterns throughout 2026.

โณ Act Now โ€” Before 2026 Denials Hit Hard

Waiting until Q2 or Q3 2026 will be too late.
The denial surge is accelerating now.

Every month you delay, you risk:

  • Unrecoverable revenue
  • Higher AR
  • Longer turnaround
  • Staff burnout
  • Diminished patient trust
  • Lower payer contract leverage

2026 will reward prepared practices โ€” and punish the reactive ones.

๐Ÿ“ž Your 2026-Ready Next Step: Schedule Your Free Revenue Cycle Assessment

Weโ€™re now equipping practices with 2026-proof denial strategies.

Your FREE Assessment includes:

  • 2026 denial vulnerability analysis
  • Payer-specific risk mapping
  • Financial recovery projections
  • A personalized 2026 acceleration blueprint

๐Ÿ‘‰ Get ahead of payer tactics.
๐Ÿ‘‰ Stop revenue leakage before 2026 begins.
๐Ÿ‘‰ Build a denial-resistant revenue cycle.

๐Ÿ“… Schedule Your FREE 2026 Revenue Cycle Assessment Today.

๐Ÿ“š References

  • Change Healthcare. 2025 Revenue Cycle Denials Index.
  • MGMA. 2025 Cost & Operational Impact of Denials in Physician Practices.
  • KFF. Medicare Advantage Prior Authorization & Denial Data 2024โ€“2025.
  • CMS. Medicare Advantage Utilization Metrics & Policy Updates for 2026.
  • AHA. Administrative Spending & Denial Appeals in U.S. Health Systems, 2025.
  • AMA. National Health Insurer Report Card, 2025 Edition.
  • Advisory Board. Projected Revenue Cycle Trends for 2026.

๐Ÿšจ Reimbursement Delays Hit Record Highs: 40% of Providers Now Wait 2+ Months for Payment

By RCAceSolutions | Revenue Growth Partner

Americaโ€™s healthcare providers are facing a financial crisis hiding in plain sight.
While youโ€™re focused on delivering exceptional patient care, an operational storm is draining your cash flow and suffocating your revenue cycle.

Payment delays have reached historic highsโ€”and the consequences are hitting practices harder than ever.

๐Ÿ“‰ 47 days โ†’ average wait for reimbursement
โณ 40% of providers โ†’ waiting 60+ days
๐Ÿ“‘ 41% โ†’ facing denial rates of 10% or more

These arenโ€™t just industry statistics.
Theyโ€™re direct threats to your practiceโ€™s financial stability.

โš ๏ธ The Perfect Storm: Why Delays Are Accelerating

Multiple pressures have collided to create the most hostile reimbursement environment in years.

1๏ธโƒฃ Denial Rates at Crisis Levels

Denials now steal millions from healthcare organizations each year.

  • 41% of providers experience denial rates โ‰ฅ10%
  • Hospitals lose up to $5M annually to denials
  • Medicare Advantage denial-related revenue reductions surged 55.7%
  • Commercial payer denials increased 20.2%

Meanwhile, Requests for Information (RFI) denials rose 10% in 2024โ€”affecting 3.5% of all gross revenue billed.

Every denied claim represents lost time, lost revenue, and lost staffing capacity.


2๏ธโƒฃ Prior Authorization: The 12-Hour Weekly Burden

Physicians now complete an average of:

๐Ÿ“„ 43 prior authorizations per week
โฑ๏ธ Consuming 12 hours of administrative time
โŒ With 25% of authorizations often denied

Administrative overload is pulling clinicians away from patient care and fueling burnout across every specialty.


3๏ธโƒฃ Medicare Cuts Tighten the Squeeze

Just as operating costs rise, reimbursements continue falling.

  • 2.83% cut from CMS in the 2025 Physician Fee Schedule
  • 6.43% net impact when combined with cost inflation
  • Hospitals receive $0.83 for every $1 spent on Medicare patients
  • Inflation: 14.1% (2022โ€“2024)
  • Medicare inpatient rate increase: 5.1%

This imbalance is not sustainableโ€”and cash flow is absorbing the hit.


4๏ธโƒฃ Cash Reserves Are Collapsing

The financial buffer many providers rely on is evaporating.

๐Ÿ’ธ Median health system cash reserves fell 28%
๐Ÿ“‰ From 173 days โ†’ 124 days in just 18 months
๐Ÿ•’ 1 in 4 payments to small providers arrives late

For many practices, the margin for error has disappeared entirely.

๐Ÿ’ฅ The Hidden Costs: Beyond the Balance Sheet

Even before revenue loss shows up in the ledger, delays trigger operational damage:

๐Ÿ”ฅ Staff Burnout & Turnover

  • Billing teams spend endless hours resubmitting claims
  • 80%+ of denials are preventable
  • But fewer than 50% are appealed

Overworked teams create new errors, expanding the cycle of loss.

๐Ÿ‘Ž Declining Patient Experience

Cash flow issues force tough decisions:

  • Delayed equipment upgrades
  • Reduced staff hours
  • Longer patient wait times

Meanwhile, 78% of providers fail to collect $1,000+ patient balances within 30 days.

โณ Permanent Revenue Loss from Aging Claims

Claims older than 90 days rapidly lose collectability.
Yet many practices lack the follow-up infrastructure needed to recover them.

๐Ÿ” Where Claims Get Stuck: The Root Causes

Understanding the bottlenecks is the first step toward fixing them.

โ— Coding Errors & Documentation Gaps

With 420 CPT updates between 2024โ€“2025, coding accuracy is more fragile than ever.

โ— Insurance Verification Failures

Lapsed or incorrect coverage = automatic denial
โ€ฆoften weeks after the encounter.

โ— Weak Follow-Up Systems

RFI denials take 60โ€“120 days to resolveโ€”even though 89% eventually result in zero revenue loss.
Cash flow suffers long before the cycle ends.

โ— Manual Processes That Donโ€™t Scale

Only 31% of providers use automation in revenue cycle operations.
Manual workflows = more errors, slower reimbursement, and skyrocketing overhead.

๐Ÿš€ How RCAceSolutions Transforms Your Revenue Cycle

In a landscape where delays are worsening, RCAceSolutions helps you regain control, stabilize cash flow, and accelerate payments.

โšก Expert Accelerated Claims Processing

RCAceSolutions delivers a higher standard of speed, accuracy, and compliance through expert-led and technology-enhanced claims processing. Our approach eliminates the bottlenecks that slow reimbursements and cause costly delays.

๐Ÿ” What Our Expert Team + Intelligent Automation Achieve for You:
  • Real-Time, Automated Eligibility Verification
    Prevent eligibility-related denials before they occur with instant verification completed before patient encounters, eliminating downstream claim rework.
  • AI-Enhanced Coding With Expert Oversight
    Our coding intelligence automatically updates CPT/ICD changes, flags discrepancies, and provides expert-reviewed corrections to ensure precision and regulatory compliance.
  • First-Pass Clean Claim Precision
    Every claim undergoes multi-layer QA, payer-rule validation, and error-proofingโ€”resulting in consistently high clean-claim rates and dramatically fewer resubmissions.
  • Expert Playbooks for Every Payer
    We apply payer-specific rules, patterns, and historical behavior insights to structure claims for maximum acceptance on the first submission.
  • Streamlined Documentation Capture
    Automated pulling, matching, and mapping of required documents ensures clean, complete submissionsโ€”reducing missing-info denials and RFI delays.

๐Ÿ›ก๏ธ Denial Prevention & Strategic Appeals

Stop denials before they occurโ€”and overturn the ones that do.

  • ๐Ÿ” Predictive Denial Analytics
  • ๐Ÿ“Œ Root Cause Mapping
  • โœ‰๏ธ Expert, documentation-backed appeals

This shifts your team from reactive chaos to proactive prevention.


๐Ÿ“จ Prior Authorization Optimization

End the 12-hour, physician-draining workload.

  • ๐Ÿ‘ฅ Dedicated authorization specialists
  • ๐Ÿ•‘ Proactive submissions
  • ๐Ÿ“Š Real-time status tracking

Your clinicians return to doing what they do bestโ€”caring for patients.


๐Ÿ’ฐ Cash Flow Acceleration

A more efficient revenue cycle means:

  • Fewer claims stuck in A/R
  • More revenue captured
  • Faster, more predictable payment cycles

Clients commonly see measurable financial lift in 90 days.

๐Ÿ“ˆ Results You Can Expect

Partnering with RCAceSolutions achieve:

  • 30โ€“40% reduction in claim denials
  • 25โ€“35% decrease in days in A/R
  • 15โ€“25% improvement in first-pass clean claims
  • 20โ€“30% increase in staff productivity
  • Greater cash flow stability and forecasting accuracy

โœจ Beyond the Numbers

The real transformation is operational:

  • Clinicians spend less time on administrative work
  • Billing teams focus on strategy, not busywork
  • Leadership gains visibility through real-time dashboards
  • Decisions become data-driven instead of reactive

This is what a modern revenue cycle should look like.

๐Ÿ The Path Forward: From Crisis to Stability

The reimbursement crisis will not improve on its own.
But your practice doesnโ€™t have to absorb the damage.

You can:
โŒ Continue fighting rising delays, denials, and shrinking margins
or
โœ… Partner with specialists who help you reverse the trend and stabilize your financial future

๐Ÿ“ž Your Next Step

RCAceSolutions provides a Complimentary Revenue Cycle Assessment that uncovers:

  • Hidden bottlenecks
  • Preventable revenue leaks
  • Denial trends
  • Financial projections
  • Recommended fixes customized to your specialty

โšก Minimal time required
โšก Zero obligation
โšก High-value insights from day one

๐Ÿ‘‰ Donโ€™t Let Payment Delays Dictate Your Future

Schedule Your FREE Revenue Cycle Assessment with RCAceSolutions today and discover how we turn reimbursement chaos into predictable, accelerated cash flow.

๐Ÿ“š References

  • American Medical Association (AMA). 2023 Prior Authorization Survey.
  • Centers for Medicare & Medicaid Services (CMS). 2025 Medicare Physician Fee Schedule Final Rule.
  • American Hospital Association (AHA). Medicare Underpayments & Inflation Impact Report (2023).
  • Journal of AHIMA. Annual Denial Management & Cost Impact Study.
  • KFF Health Policy Data. Payer Denial & RFI Trends 2022โ€“2024.
  • MGMA & HFMA Industry Benchmarks. Revenue Cycle Performance & Cash Flow Indicators.
  • CPT Editorial Panel. 2024โ€“2025 CPT Code Set Updates.

๐Ÿšจ 40% of Hospitals Now Operating in the Red: Why Strategic RCM Will Decide Your Practiceโ€™s Future

By RCAceSolutions | Revenue Growth Partner

While youโ€™re focused on caring for patients, your revenue cycle might be quietly collapsing โ€” and the consequences are now too big to ignore.

A Crisis Thatโ€™s Already Closing Doors

2024 exposed a disturbing truth: 40% of U.S. hospitals are operating in the red. And 2025 is continuing the trend โ€” with 19+ hospital closures already impacting metro and rural communities alike.

Many believed: โ€œIt wonโ€™t happen to us.โ€
Until payroll panicโ€ฆ unpaid claimsโ€ฆ a critical closure noticeโ€ฆ

The practices that survive arenโ€™t the ones seeing more patients.
Theyโ€™re the ones capturing the revenue theyโ€™ve already earned.

The Three-Front Financial Attack Threatening Your Practice

๐Ÿ“ˆ 1๏ธโƒฃ Escalating Costs Outpacing Reimbursements

General inflation jumped 12.4% (2021โ€“2023) โ€” yet reimbursement adjustments lag far behind.

Operational costs keep climbing:

  • Drug expenses: +12% YoY
  • Supply costs: +11% YoY
  • Purchased services: +10% YoY
  • Labor costs remain historically high

Your expenses are accelerating.
Your revenue? Not so much.


๐Ÿšซ 2๏ธโƒฃ Claim Denials at an All-Time High

Initial denial rates surged to 11.8% in 2024 โ€” nearly 1 in 9 claims.

More alarming:

  • 41% of providers report >10% denial rates
  • Medicare Advantage denials hit 17%
  • Medical necessity denials: +5% YoY
  • Total denial burden: โ‰ˆ $260B lost annually

โ— Even a 1% increase in denials =
โ‰ˆ $2M in lost revenue per 100-bed hospital


๐Ÿ’ธ 3๏ธโƒฃ Patient Balances Are Becoming Uncollectible

High deductibles = low collections:

  • Insured patient collections dropped from 37.6% โ†’ 34.5%
  • Thatโ€™s $3 less per $100 owed โ€” multiplied across thousands of encounters

Patients owe moreโ€ฆ and are paying less.


Why โ€œWorking Harderโ€ Is No Longer Working

Your team is already stretched to capacity.
But more effort in broken systems only accelerates burnout.

The problem isnโ€™t productivity โ€” itโ€™s preventable revenue leakage.

๐Ÿฉธ Youโ€™re providing the careโ€ฆ but not collecting the revenue.

The Solution: Strategic Revenue Cycle Management

RCM is no longer just billing โ€”
It is your Financial Survival System.

When properly implemented, Strategic RCM:
โœ” Cuts denials before they happen
โœ” Accelerates cash flow
โœ” Improves net collections
โœ” Lowers administrative burden
โœ” Enhances patient satisfaction
โœ” Strengthens compliance
โœ” Protects long-term viability

๐Ÿ’ก Introducing The RCM ACE Systemโ„ข

Analyze โ†’ Capture โ†’ Elevate

A proven 3-phase framework tailored to healthcare providers:

1๏ธโƒฃ Analyze โ†’ Reveal Hidden Revenue

Identify failure points from front desk to payer payment:

  • Eligibility gaps
  • Coding errors
  • Missing charge capture
  • Delayed submissions

2๏ธโƒฃ Capture โ†’ Stop Revenue Leakage

Optimize workflows + technology so every service = revenue collected:

  • Clean claim creation
  • Predictive denial prevention
  • A/R and appeals optimization

3๏ธโƒฃ Elevate โ†’ Sustain Performance

Real-time insights and compliance-first improvement:

  • Financial dashboards
  • Staff enablement
  • Continuous automation

This is the difference between surviving and scaling.

๐Ÿ“Š How Do You Measure Up?

RCM Performance Scorecard (Quick Check)

KPIHealthyAt RiskCritical
Initial Denial Rate<5%6โ€“10%10%
Days in A/R<4041โ€“6060
Net Collection Rate95โ€“100%90โ€“94%<90%
Patient Collection Rate40%30โ€“39%<30%

If you have even one item in the red โ€”
your financial stability is already compromised.

๐Ÿค Why Practices Partner With RCAceSolutions

We donโ€™t just theorize RCM.
We fix it.

Immediate Impact (First 90 Days)

  • Recover aged A/R others wrote off
  • Prevent denials before they occur
  • Accelerate payments and cash flow

Long-Term Sustainability

  • Front-end accuracy โ†’ clean claims
  • Mid-cycle precision โ†’ correct billing
  • Back-end follow-through โ†’ full payments

Performance Gains We Deliver

๐Ÿ“ˆ Typical results within 6โ€“9 months:

  • 35โ€“50% reduction in denials
  • 20โ€“40% boost in first-pass acceptance
  • 25โ€“35% faster reimbursement
  • 15โ€“25% higher net collections
  • 10โ€“20 fewer A/R days

The Cost of Doing Nothing

Revenue leakage is silent and deadly:

๐Ÿฉธ Every day without RCM improvement = lost revenue you can never recover.

Closure doesnโ€™t happen overnight.
It happens claim by claimโ€ฆ until itโ€™s too late.

Your Move Determines Your Future

The gap between financially thriving and failing organizations is widening โ€” fast.

Those who win donโ€™t work harder.
They collect smarter.

Your Next Step: Take Control

๐ŸŽฏ Get Your Free RCM Performance Mapโ„ข

A 30-minute assessment that reveals:
โœ” Exact revenue youโ€™re losing
โœ” Top 3 areas to fix immediately
โœ” A prioritized roadmap to improvement

No disruption.
No obligation.
Limited spots each month.

๐Ÿ“… Schedule Your Free RCM Assessment

๐Ÿ‘‰ If you donโ€™t know your denial rate or A/R daysโ€ฆ
your practice is already at risk.

Because every dollar youโ€™ve earned should reach your account โ€” not vanish into preventable errors, denials, or inefficiencies.

๐Ÿ“š References

  • Kaufman Hall. National Hospital Flash Report, 2024โ€“2025 Editions.
  • American Hospital Association (AHA). Hospital Financial Pressures and Closures Analysis, 2024โ€“2025.
  • Centers for Medicare & Medicaid Services (CMS). Inpatient Prospective Payment System Updates, 2021โ€“2025.
  • HFMA & MGMA Joint Reports. Claim Denial Trends and Revenue Cycle Benchmarks, 2023โ€“2025.
  • AMGA Analytics. Healthcare Inflation Impact Study, 2024.
  • Experian Health. Patient Responsibility and Collections Data, 2023โ€“2024.

(All statistics sourced from widely recognized industry financial and RCM benchmark publications.)